
Last major update issued on December 3, 2003 at 04:25 UTC.
[Solar and geomagnetic data - last month (updated daily)]
[Solar wind and electron fluence charts (updated daily)]
[Solar cycles 21-23 (last update December 2, 2003)]
[Solar cycles 1-20]
[Graphical comparison of cycles 21, 22 and 23 (last update December 2, 2003)]
[Graphical comparison of cycles 2, 10, 13, 17, 20 and 23 (last update December
2, 2003)]
[Historical solar and geomagnetic data charts 1954-2003 (last update October 15, 2003)]
[Archived reports (last update December 1, 2003)]
The geomagnetic field was quiet to unsettled on December 2. Solar wind speed ranged between 374 and 469 km/sec.
Solar flux measured at 20h UTC on 2.8 GHz was 139.3. The planetary A
index was 9 (STAR Ap - based on the mean of three hour interval ap indices: 9.9).
Three hour interval K indices: 32332231 (planetary), 22322222 (Boulder).
The background x-ray flux is at the class B5 level.
At midnight there were 7 spotted regions on the visible disk. Solar flare activity was moderate. A total of 9 C and 2 M class events were recorded during the day.
Region 10508 at and just behind the southwest limb became very active. Flares: C1.0 at 03:43,
C1.0 at 07:01, C1.3 at 07:20, C3.9 at 08:07, C7.2 at 09:48, C8.5 long duration event peaking at 11:50, M1.4 at 13:08, C2.0 at
19:21, C5.0 at 21:09, C1.4 at 22:10 and M1.5 at 23:00 UTC. The C8 event was likely a proton flare as well, an above 10 MeV proton
event peaked just below the 100 pfu level at 17:30 UTC.
Region 10509 decayed slowly and quietly.
Region 10510 decayed and had only a single small spot left by the end of the day. The region could become spotless today.
Region 10513 was quiet and stable.
Region 10515 decayed slowly and was quiet.
Region 10516 was mostly unchanged in the leading spot section while slow decay occurred in other parts of the region.
There is some polarity intermixing in both the leading and trailing spot sections.
Region 10517 was quiet and stable.
Spotted regions not numbered by NOAA/SEC:
[S318] A new region emerged southeast of region 10516 on November 30. Location at midnight: S22E21.
December 2: A full halo CME was observed in LASCO C3 images beginning at 11:18 UTC. This CME was large and very wide. While expansion was fast off of the west limb, the CME was faint and slow over the east limb. A flank CME impact is possible on December 5 or 6.
November 30 - December 1: No partly or fully earth directed CMEs observed.
Coronal hole history (since late October 2002)
Compare today's report with the situation one solar rotation ago: 28
days ago 27 days ago 26 days ago
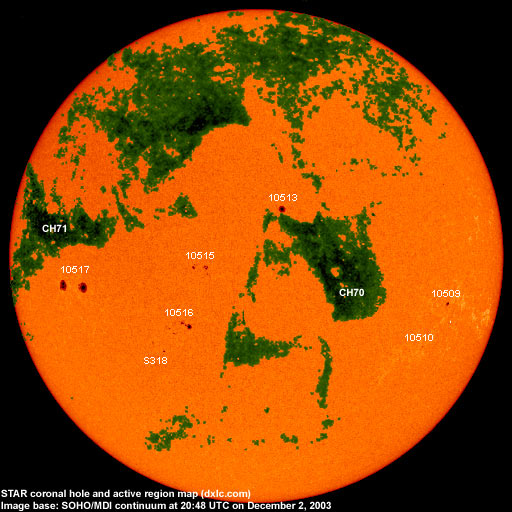
A recurrent trans equatorial coronal hole (CH70) was in a geoeffective position on November 30 - December 2. A large recurrent trans equatorial coronal hole (CH71) is rotating into view at the east limb and will likely reach a geoeffective position on December 5 or 6 with the associated high speed stream influencing the Earth from December 7 or 8.
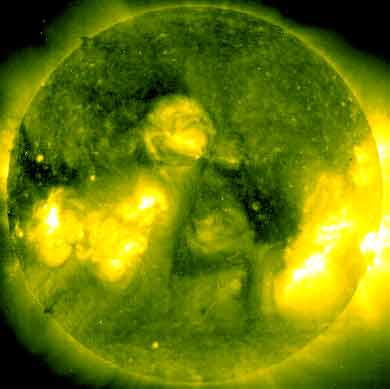
Processed SOHO/EIT 284 image at 19:05 UTC on December 2. The darkest areas on the solar disk are likely coronal holes.
The geomagnetic field is expected to be quiet to unsettled during the first half of December 3. Then a high speed stream from coronal hole CH70 is expected to reach Earth and cause unsettled to major storm conditions until December 5. A weak CME impact is possible on December 5 or 6 and could result in unsettled to active conditions. A strong high speed stream from coronal hole CH71 should dominate the solar wind from December 8 until approximately December 15.
Long distance low frequency (below 2 MHz) propagation along east-west paths over high and upper middle latitudes is very poor. Propagation along long distance north-south paths is good. [Trans Atlantic propagation conditions are currently monitored every night on 1470 kHz. Dominant station tonight: Radio Cristal del Uruguay with an excellent signal at times. Other stations noted were Radio Vibraci�n (Venezuela), CPN Radio (Per�), Radio Rafaela (Argentina) and 2 unidentified stations from Brazil. R�dio Cristal (Brazil) on 1350 kHz was super strong and 1590 kHz offered Radio Real (Uruguay), 2 unidentified stations with Spanish and 1 unidentified from Brazil].
| Coronal holes (1) | Coronal mass ejections (2) | M and X class flares (3) |
1) Effects from a coronal hole could reach Earth within the next 5 days. When the high speed stream has arrived
the color changes to green.
2) Material from a CME is likely to impact Earth within 96 hours.
3) There is a possibility of either M or X class flares within the next 48 hours.
Green: 0-20% probability, Yellow: 20-60% probability, Red: 60-100% probability.
Compare to the previous day's image.
Data for all numbered solar regions according to the Solar Region Summary provided by NOAA/SEC. Comments are my own, as is the STAR spot count (spots observed at or inside a few hours before midnight) and data for regions not numbered by SEC or where SEC has observed no spots. SEC active region numbers in the table below and in the active region map above are the historic SEC/USAF numbers.
| Active region | Date numbered | SEC spot count |
STAR spot count |
Location at midnight | Area | Classification | Comment |
|---|---|---|---|---|---|---|---|
| 10509 | 2003.11.24 | 2 | 1 | S11W52 | 0030 | HSX | |
| 10510 | 2003.11.24 | 10 | 1 | S22W45 | 0020 | BXO |
classification was AXX at midnight, area 0010 |
| 10511 | 2003.11.25 | 6 | S14W71 | 0040 | BXO | spotless | |
| 10512 | 2003.11.25 | N06W62 | plage | ||||
| 10513 | 2003.11.26 | 1 | 1 | N12W07 | 0060 | HSX | |
| 10515 | 2003.11.28 | 9 | 9 | S02E13 | 0040 | DSO |
classification was DAO at midnight |
| 10516 | 2003.11.28 | 15 | 14 | S16E18 | 0050 | DSO |
beta-gamma classification was DAO at midnight |
| 10517 | 2003.11.30 | 6 | 7 | S06E47 | 0350 | DAO | |
| S314 | emerged on 2003.11.27 |
S15W43 | plage | ||||
| S318 | emerged on 2003.11.30 |
3 | S22E21 | 0020 | CRO | ||
| Total spot count: | 49 | 36 | |||||
| SSN: | 119 | 106 | |||||
| Month | Average solar flux at Earth |
International sunspot number | Smoothed sunspot number |
|---|---|---|---|
| 2000.04 | 184.2 | 125.5 | 120.8 cycle 23 sunspot max. |
| 2000.07 | 202.3 | 170.1 | 119.8 |
| 2001.12 | 235.1 | 132.2 | 114.6 (-0.9) |
| 2002.11 | 168.7 | 95.5 | 85.2 (-5.3) |
| 2002.12 | 157.2 | 80.8 | 82.0 (-3.2) |
| 2003.01 | 144.0 | 79.7 | 80.9 (-1.1) |
| 2003.02 | 124.5 | 46.0 | 78.5 (-2.4) |
| 2003.03 | 131.4 | 61.1 | 74.1 (-4.4) |
| 2003.04 | 126.4 | 60.0 | 70.3 (-3.8) |
| 2003.05 | 115.7 | 55.2 | 67.8 (-2.5) |
| 2003.06 | 129.3 | 77.4 | (65.3 predicted, -2.5) |
| 2003.07 | 127.7 | 85.0 | (61.9 predicted, -3.4) |
| 2003.08 | 122.1 | 72.7 | (59.0 predicted, -2.9) |
| 2003.09 | 112.2 | 48.8 | (57.0 predicted, -2.0) |
| 2003.10 | 151.7 | 65.6 | (54.3 predicted, -2.7) |
| 2003.11 | 140.8 | 67.2 | (51.6 predicted, -2.7) |
| 2003.12 | 141.3 (1) | 9.0 (2) | (49.0 predicted, -2.6) |
1) Running average based on the daily 20:00 UTC observed solar flux value at 2800 MHz.
2) Unofficial, accumulated value based on the Boulder (NOAA/SEC) sunspot number. The official international sunspot number is typically
30-50% less.
This report has been prepared by Jan Alvestad. It is based partly on my own observations and analysis, and partly on data from sources noted in solar links. All time references are to the UTC day. Comments and suggestions are always welcome.
| [DX-Listeners' Club] |