
Last major update issued on December 11, 2003 at 04:40 UTC.
[Solar and geomagnetic data - last month (updated daily)]
[Solar wind and electron fluence charts (updated daily)]
[Solar cycles 21-23 (last update December 2, 2003)]
[Solar cycles 1-20]
[Graphical comparison of cycles 21, 22 and 23 (last update December 2, 2003)]
[Graphical comparison of cycles 2, 10, 13, 17, 20 and 23 (last update December
2, 2003)]
[Historical solar and geomagnetic data charts 1954-2003 (last update October 15, 2003)]
[Archived reports (last update December 8, 2003)]
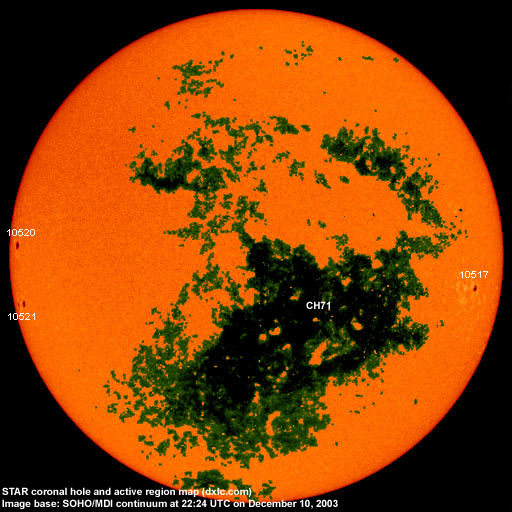
The geomagnetic field was active to major storm on December 10. Solar wind speed ranged between 586 and 879 km/sec under the influence of a high speed stream from coronal hole CH71.
Solar flux measured at 20h UTC on 2.8 GHz was 89.2 (this is the lowest solar flux at 20h UTC since March 22, 2003. Adjusted to
1 AU solar flux was 86.5, the lowest since February 2, 1998). The planetary A
index was 42 (STAR Ap - based on the mean of three hour interval ap indices: 43.0).
Three hour interval K indices: 54565554 (planetary), 63554544 (Boulder).
The background x-ray flux is at the class A8 level.
At midnight there were 3 spotted regions on the visible disk. Solar flare activity was very low.
Region 10517 decayed further and will rotate over the southwest limb on Dec.12.
New region 10520 rotated into view at the northeast limb early in the day.
New region 10521 rotated into view at the southeast limb early in the day.
December 8-10: No partly or fully earth directed CMEs observed.
Coronal hole history (since late October 2002)
Compare today's report with the situation one solar rotation ago: 28
days ago 27 days ago 26 days ago
A huge recurrent trans equatorial coronal hole (CH71) will be in a geoeffective position on December 5-11. Some decay was observed in the northern and western parts on December 9-10.

Processed SOHO/EIT 284 image at 19:06 UTC on December 10. The darkest areas on the solar disk are likely coronal holes.
The geomagnetic field is expected to be unsettled to minor storm with occasional major storm intervals until December 14 or 15 due to a strong high speed stream from coronal hole CH71.
Long distance low frequency (below 2 MHz) propagation along east-west paths over high and upper middle latitudes is poor to fair. Propagation along long distance north-south paths is fair to good. [Trans Atlantic propagation conditions are currently monitored every night on 1470 kHz. Dominant stations tonight: None. A number of stations were heard at various times: Radio Cristal del Uruguay, Radio Rafaela (Argentina), another unidentified station from Argentina and these stations from Brazil: Rádio Papacaça AM, Rádio Jornal Fluminense and Rádio Morro Verde. On my antenna to the west WLAM Lewiston ME with their WMTW relay was noted at times. Several other east coast US stations could be heard despite the auroral conditions, e.g. WTOP Washington DC on 1500 and WWZN Boston MA on 1510 kHz].
| Coronal holes (1) | Coronal mass ejections (2) | M and X class flares (3) |
1) Effects from a coronal hole could reach Earth within the next 5 days. When the high speed stream has arrived
the color changes to green.
2) Material from a CME is likely to impact Earth within 96 hours.
3) There is a possibility of either M or X class flares within the next 48 hours.
Green: 0-20% probability, Yellow: 20-60% probability, Red: 60-100% probability.
Compare to the previous day's image.
Data for all numbered solar regions according to the Solar Region Summary provided by NOAA/SEC. Comments are my own, as is the STAR spot count (spots observed at or inside a few hours before midnight) and data for regions not numbered by SEC or where SEC has observed no spots. SEC active region numbers in the table below and in the active region map above are the historic SEC/USAF numbers.
| Active region | Date numbered | SEC spot count |
STAR spot count |
Location at midnight | Area | Classification | Comment |
|---|---|---|---|---|---|---|---|
| 10516 | 2003.11.28 | 1 | S16W92 | 0060 | HSX | rotated out of view | |
| 10517 | 2003.11.30 | 1 | 1 | S08W64 | 0070 | HSX |
area was 0050 at midnight |
| 10518 | 2003.12.03 | S21W81 | plage | ||||
| 10520 | 2003.12.10 | 2 | 1 | N03E75 | 0120 | HAX |
classification was HSX at midnight, area 0080 |
| 10521 | 2003.12.10 | 2 | 3 | S11E82 | 0060 | DAO |
classification was DSO at midnight, location was S12E74 |
| S320 | emerged on 2003.12.05 |
S08W78 | plage | ||||
| Total spot count: | 6 | 5 | |||||
| SSN: | 46 | 35 | |||||
| Month | Average solar flux at Earth |
International sunspot number | Smoothed sunspot number |
|---|---|---|---|
| 2000.04 | 184.2 | 125.5 | 120.8 cycle 23 sunspot max. |
| 2000.07 | 202.3 | 170.1 | 119.8 |
| 2001.12 | 235.1 | 132.2 | 114.6 (-0.9) |
| 2002.11 | 168.7 | 95.5 | 85.2 (-5.3) |
| 2002.12 | 157.2 | 80.8 | 82.0 (-3.2) |
| 2003.01 | 144.0 | 79.7 | 80.9 (-1.1) |
| 2003.02 | 124.5 | 46.0 | 78.5 (-2.4) |
| 2003.03 | 131.4 | 61.1 | 74.1 (-4.4) |
| 2003.04 | 126.4 | 60.0 | 70.3 (-3.8) |
| 2003.05 | 115.7 | 55.2 | 67.8 (-2.5) |
| 2003.06 | 129.3 | 77.4 | (65.3 predicted, -2.5) |
| 2003.07 | 127.7 | 85.0 | (61.9 predicted, -3.4) |
| 2003.08 | 122.1 | 72.7 | (59.0 predicted, -2.9) |
| 2003.09 | 112.2 | 48.8 | (57.0 predicted, -2.0) |
| 2003.10 | 151.7 | 65.6 | (54.3 predicted, -2.7) |
| 2003.11 | 140.8 | 67.2 | (51.6 predicted, -2.7) |
| 2003.12 | 111.0 (1) | 27.1 (2) | (49.0 predicted, -2.6) |
1) Running average based on the daily 20:00 UTC observed solar flux value at 2800 MHz.
2) Unofficial, accumulated value based on the Boulder (NOAA/SEC) sunspot number. The official international sunspot number is typically
30-50% less.
This report has been prepared by Jan Alvestad. It is based partly on my own observations and analysis, and partly on data from sources noted in solar links. All time references are to the UTC day. Comments and suggestions are always welcome.
| [DX-Listeners' Club] |