
Last major update issued on November 14, 2003 at 04:25 UTC.
[Solar and geomagnetic data - last month (updated daily)]
[Solar wind and electron fluence charts (updated daily)]
[Solar cycles 21-23 (last update November 4, 2003)]
[Solar cycles 1-20]
[Graphical comparison of cycles 21, 22 and 23 (last update November 4, 2003)]
[Graphical comparison of cycles 2, 10, 13, 17, 20 and 23 (last update November
4, 2003)]
[Historical solar and geomagnetic data charts 1954-2003 (last update October 15, 2003)]
[Archived reports (last update November 12, 2003)]
The geomagnetic field was unsettled to major storm on November 13. Solar wind speed ranged between 581 and 759 km/sec under the influence of a high speed stream from coronal hole CH66. The interplanetary magnetic field became stronger after 11h UTC and stronger southward swings were observed in ACE data (While ACE SWEPAM data seems to be OK, several of the proton sensors on ACE seems to have sustained permanent damage by the proton and solar storms during late October and early November.)
Solar flux measured at 20h UTC on 2.8 GHz was 102.1. The planetary A
index was 42 (STAR Ap - based on the mean of three hour interval ap indices: 43.4).
Three hour interval K indices: 35456554 (planetary), 35445545 (Boulder).
The background x-ray flux is at the class B3 level.
At midnight there were 2 spotted regions on the visible disk. Solar flare activity was moderate. A total of 2 C and 2 M class events were recorded during the day. Region 10498, at the west limb, was (as observed by GOES SXI) the source of a C1.6 flare at 16:00 UTC.
New region 10501 rotated into view on November 13. This is a moderately large, compact region with two penumbrae and is likely old region 10484. There is a magnetic delta structure in both penumbrae with the strongest delta located in the northern penumbra. Major flares are possible. Flares: impulsive M1.6 at 05:01, long duration M1.4 peaking at 09:29 (associated with a strong type II radio sweep) and C5.0 at 11:08 UTC.
Spotted regions not numbered by NOAA/SEC:
[S301] This region emerged early on November 13 ahead of region 10501. Location at midnight: N06E54.
November 13: A bright, very wide, halo CME was observed in LASCO C3 images beginning at 10:20 UTC. The source of this CME was an M1 long duration event in region 10501. While the CME was impressive over the east limbs, only a faint front was visible over the west limbs. The CME could reach the Earth on November 16, however, only a weak sideways impact is expected. The CME is likely to be embedded in a high speed stream and could be hard to detect when it arrives.
November 12: A full halo CME was observed in LASCO C3 images beginning at 11:18 UTC. The distribution of the ejected material indicates that the source was about 5 days behind the northeast limb. This is the expected position of old region 10488.
November 11: A full halo CME was observed in LASCO C3 images beginning at 02:42 UTC. The distribution of the ejected
material indicates that the source was region 10486 several days behind the southwest limb.
Another full halo CME was observed in LASCO C3 images beginning at 15:18 UTC. The source of this CME was likely the M1.6 flare in
region 10498. The CME was fast (above 1300 km/sec) in the core part, the slower outer edge could reach the Earth on November 14. In the presence of a high speed stream the CME is not likely to cause
any significant disturbance.
Coronal hole history (since late October 2002)
Compare today's report with the situation one solar rotation ago: 28
days ago 27 days ago 26 days ago
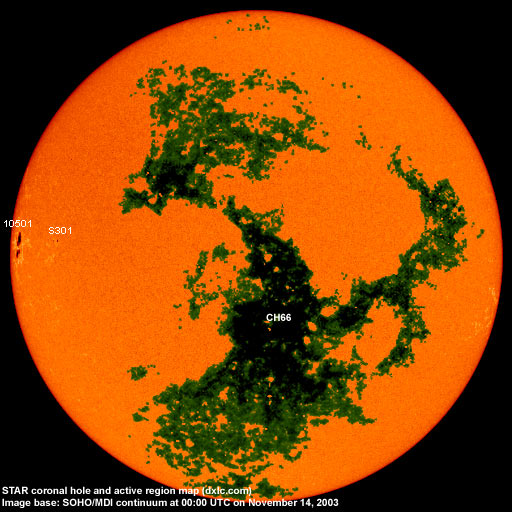
A well defined recurrent trans equatorial coronal hole (CH66) was in a geoeffective position on November 9-14. The coronal hole is best defined in the easternmost and westernmost parts and has increased its area during the last solar rotation.
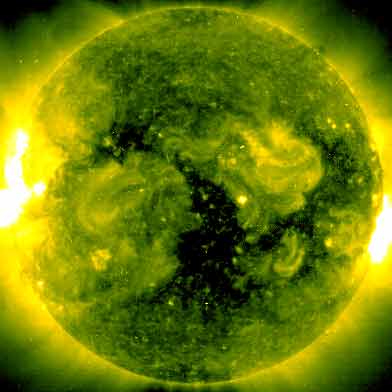
Processed SOHO/EIT 284 image at 01:06 UTC on November 14. The darkest areas on the solar disk are likely coronal holes.
The geomagnetic field is expected to be active to major storm on November 14-17 due to a high speed stream from coronal hole CH66.
Long distance low frequency (below 2 MHz) propagation along east-west paths over high and upper middle latitudes is useless. Propagation along long distance north-south paths is very poor. [Trans Atlantic propagation conditions are currently monitored every night on 1470 kHz. Dominant station tonight: no signals detected. A few stations from Brazil were heard weakly on other frequencies, e.g. R�dio Nacional in Brasilia on 980 kHz.].
| Coronal holes (1) | Coronal mass ejections (2) | M and X class flares (3) |
1) Effects from a coronal hole could reach Earth within the next 5 days. When the high speed stream has arrived
the color changes to green.
2) Material from a CME is likely to impact Earth within 96 hours.
3) There is a possibility of either M or X class flares within the next 48 hours.
Green: 0-20% probability, Yellow: 20-60% probability, Red: 60-100% probability.
Compare to the previous day's image.
Data for all numbered solar regions according to the Solar Region Summary provided by NOAA/SEC. Comments are my own, as is the STAR spot count (spots observed at or inside a few hours before midnight) and data for regions not numbered by SEC or where SEC has observed no spots.
| Solar region | Date numbered | SEC spot count |
STAR spot count |
Location at midnight | Area | Classification | Comment |
|---|---|---|---|---|---|---|---|
| 10498 | 2003.11.08 | 2 | S02W91 | 0110 | DAO | rotated out of view | |
| 10499 | 2003.11.08 | S16W87 | plage | ||||
| 10500 | 2003.11.09 | S07W74 | plage | ||||
| 10501 | 2003.11.13 | 3 | 8 | N04E74 (SEC: N05E65) |
0340 | FSO |
gamma-delta classification was DKC at midnight SEC has erroneously included the spots of region S301 |
| S301 | emerged on 2003.11.13 |
3 | N06E54 | 0030 | CSO | ||
| Total spot count: | 5 | 11 | |||||
| SSN: | 25 | 31 | |||||
| Month | Average solar flux at Earth |
International sunspot number | Smoothed sunspot number |
|---|---|---|---|
| 2000.04 | 184.2 | 125.5 | 120.8 cycle 23 sunspot max. |
| 2000.07 | 202.3 | 170.1 | 119.8 |
| 2001.12 | 235.1 | 132.2 | 114.6 (-0.9) |
| 2002.10 | 167.0 | 97.5 | 90.5 (-4.1) |
| 2002.11 | 168.7 | 95.5 | 85.2 (-5.3) |
| 2002.12 | 157.2 | 80.8 | 82.0 (-3.2) |
| 2003.01 | 144.0 | 79.7 | 80.9 (-1.1) |
| 2003.02 | 124.5 | 46.0 | 78.5 (-2.4) |
| 2003.03 | 131.4 | 61.1 | 74.1 (-4.4) |
| 2003.04 | 126.4 | 60.0 | 70.3 (-3.8) |
| 2003.05 | 115.7 | 55.2 | (66.8 predicted, -3.5) |
| 2003.06 | 129.3 | 77.4 | (63.0 predicted, -3.8) |
| 2003.07 | 127.7 | 85.0 | (59.3 predicted, -3.7) |
| 2003.08 | 122.1 | 72.7 | (56.3 predicted, -3.0) |
| 2003.09 | 112.2 | 48.8 | (54.3 predicted, -2.0) |
| 2003.10 | 151.7 | 65.6 | (51.6 predicted, -2.7) |
| 2003.11 | 124.3 (1) | 29.7 (2) | (48.9 predicted, -2.7) |
1) Running average based on the daily 20:00 UTC observed solar flux value at 2800 MHz.
2) Unofficial, accumulated value based on the Boulder (NOAA/SEC) sunspot number. The official international sunspot number is typically
30-50% less.
This report has been prepared by Jan Alvestad. It is based partly on my own observations and analysis, and partly on data from sources noted in solar links. All time references are to the UTC day. Comments and suggestions are always welcome.
| [DX-Listeners' Club] |