
Last update issued on February 10, 2003 at 03:40 UTC.
[Solar and geomagnetic data
- last 4 weeks (updated daily)]
[Solar wind and electron
fluence charts (updated daily)]
[Solar cycles 21-23 (last
update February 2, 2003)]
[Solar cycles 1-20]
[Graphical comparison of
cycles 21, 22 and 23 (last update February 2, 2003)]
[Graphical comparison of
cycles 10, 13, 17, 20 and 23 (last update February 2, 2003)]
[Historical solar and geomagnetic
data charts 1954-2002 (last update January 27, 2003)]
[Archived reports (last update February 3, 2003)]
The geomagnetic field was quiet to active on February 9. Solar wind speed ranged between 420 and 521 km/sec under the influence of a coronal stream.
Solar flux measured at 20h UTC on 2.8 GHz was 141.4. The planetary A
index was 15 (STAR Ap - based on the mean of three hour interval ap indices: 15.6).
Three hour interval K indices: 33423433 (planetary), 33422422 (Boulder).
The background x-ray flux is at the class B3 level.
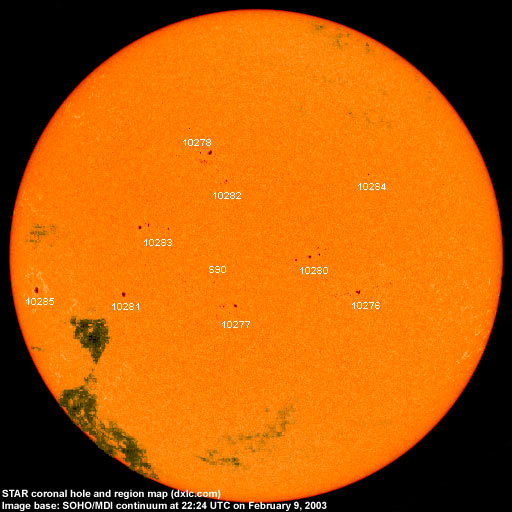
At midnight there were 10 spotted regions on the visible disk, 1 of which has not yet been numbered by SEC/NOAA. Solar flare activity was very low (no C class flaring).
Region 10276 decayed slowly losing most of its small spots. A centrally located penumbra increased its area.
Region 10277 developed slowly and quietly.
Region 10278 decayed slowly and quietly.
Region 10280 developed slowly and quietly.
Region 10281 was quiet and stable.
Region 10282 reemerged with a few spots.
Region 10283 decayed, particularly in the leading spots.
Region 10284 decayed and could soon become spotless.
Region 10285 was quiet and stable.
New region 10286 emerged in the southwest quadrant, decayed and was spotless by midnight.
Spotted regions not yet numbered by SEC/NOAA:
[S90] A new region emerged in the southeast quadrant on February and has since been visible some days. Location at midnight:
S13E07.
February 7-9: No obviously geoeffective CMEs observed.
Coronal hole history (since late October 2002)
Compare today's report with the situation one solar rotation ago: 28
days ago 27 days ago 26 days ago
A coronal hole in the southern hemisphere is currently rotating into view. It remains to be seen if it has any possibly geoeffective extensions.
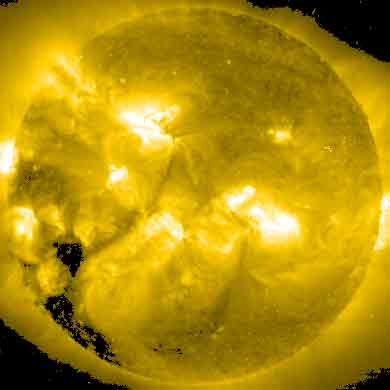
Processed SOHO EIT 284 image at 01:06 UTC on February 10. Any black areas on the solar disk are likely coronal holes.
The geomagnetic field is expected to be quiet to unsettled on February 9-12 with occasional active intervals. Long distance medium wave (AM) band propagation along east-west paths over high and upper middle latitudes is very poor, propagation along north-south paths is fair.
| Coronal holes (1) | Coronal mass ejections (2) | M and X class flares (3) |
1) Effects from a coronal hole could reach Earth within the
next 5 days.
2) Material from a CME is likely to impact Earth within 96 hours.
3) There is a possibility of either M or X class flares within the next 48
hours.
Green: 0-20% probability, Yellow: 20-60% probability, Red: 60-100% probability.
Compare to the previous day's image.
Data for all numbered solar regions according to the Solar Region Summary provided by SEC/NOAA. Comments are my own, as is the STAR spot count (spots observed at or inside a few hours before midnight) and data for regions not numbered by SEC or where SEC has observed no spots.
| Solar region | Date numbered | SEC spot count |
STAR spot count |
Location at midnight | Area | Classification | Comment |
|---|---|---|---|---|---|---|---|
| 10274 | 2003.01.28 | 1 | S05W86 | 0050 | HSX | rotated out of view | |
| 10276 | 2003.02.01 | 28 | 13 | S12W26 | 0070 | EAC |
classification was EAO at midnight |
| 10277 | 2003.02.04 | 8 | 10 | S19E06 | 0030 | DSO | |
| 10278 | 2003.02.04 | 13 | 10 | N17E12 | 0060 | DAO | |
| 10279 | 2003.02.05 | S12W48 | now spotless | ||||
| 10280 | 2003.02.06 | 8 | 7 | S07W13 | 0030 | DSO |
area was 0050 at midnight |
| 10281 | 2003.02.06 | 1 | 1 | S15E33 | 0030 | HSX | |
| 10282 | 2003.02.07 | 2 | 2 | N11E08 | 0010 | AXX | |
| 10283 | 2003.02.07 | 13 | 7 | N00E25 | 0050 | DSO | |
| 10284 | 2003.02.08 | 4 | 1 | N13W26 | 0020 | CSO |
classification was AXX at midnight, area 0010 |
| 10285 | 2003.02.08 | 1 | 1 | S11E65 | 0070 | HAX | |
| 10286 | 2003.02.09 | 5 | S11W17 | 0010 | CSO | now spotless | |
| S88 | emerged on 2003.02.04 |
S08W53 | plage | ||||
| S90 | emerged on 2003.02.04 |
2 | S13E07 | 0010 | AXX | ||
| S96 | emerged on 2003.02.06 |
S03W34 | plage | ||||
| Total spot count: | 84 | 54 | |||||
| SSN: | 194 | 154 | |||||
| Month | Average solar flux at Earth |
International sunspot number | Smoothed sunspot number |
|---|---|---|---|
| 2000.04 | 184.2 | 125.5 | 120.8 cycle 23 sunspot max. |
| 2000.07 | 202.3 | 170.1 | 119.8 |
| 2001.12 | 235.1 | 132.2 | 114.6 (-0.9) |
| 2002.01 | 226.6 | 114.1 | 113.5 (-1.1) |
| 2002.02 | 205.0 | 107.4 | 114.6 (+1.2) |
| 2002.03 | 179.5 | 98.4 | 113.3 (-1.3) |
| 2002.04 | 189.8 | 120.7 | 110.5 (-2.9) |
| 2002.05 | 178.4 | 120.8 | 108.8 (-1.7) |
| 2002.06 | 148.7 | 88.3 | 106.2 (-2.6) |
| 2002.07 | 173.5 | 99.6 | 102.7 (-3.5) |
| 2002.08 | 183.6 | 116.4 | (99.7 predicted, -3.0) |
| 2002.09 | 175.8 | 109.6 | (96.7 predicted, -3.0) |
| 2002.10 | 167.0 | 97.5 | (93.2 predicted, -3.5) |
| 2002.11 | 168.7 | 95.0 | (88.0 predicted, -5.2) |
| 2002.12 | 157.2 | 81.6 | (83.6 predicted, -4.4) |
| 2003.01 | 144.0 | 79.5 | (80.6 predicted, -3.0) |
| 2003.02 | 137.5 (1) | 36.3 (2) | (75.5 predicted, -5.1) |
1) Running average based on the daily 20:00 UT observed solar flux value at 2800
MHz.
2) Unofficial, accumulated value based on the Boulder (SEC/NOAA) sunspot number. The official
international sunspot number is typically 25-45% less.
This report has been prepared by Jan Alvestad. It is based partly on my own observations and interpretations, and partly on data from sources noted in solar links. All time references are to the UTC day. Comments and suggestions are always welcome.
| [DX-Listeners' Club] |