
Last update January 15, 2003 at 04:10 UTC.
[Solar and geomagnetic data
- last 4 weeks (updated daily)]
[Solar wind and electron
fluence charts (updated daily)]
[Solar cycles 21-23 (last
update January 1, 2003)]
[Solar cycles 1-20]
[Graphical comparison of
cycles 21, 22 and 23 (last update January 1, 2003)]
[Graphical comparison of
cycles 10, 13, 17, 20 and 23 (last update January 1, 2003)]
[Historical solar and geomagnetic
data charts 1954-2002 (last update October 13, 2002)]
[Archived reports (last update January 13, 2003)]
The geomagnetic field was quiet to unsettled on January 14. Solar wind speed ranged between 336 and 417 km/sec, under the influence of a weak coronal stream most of the day. A new and small coronal hole was observed in the northern hemisphere on January 10 and was reported in S.T.A.R. on January 11.
Solar flux measured at 20h UTC on 2.8 GHz was 164.0. The planetary A
index was 10 (STAR Ap - based on the mean of three hour interval ap indices: 11.3).
Three hour interval K indices: 33333321 (planetary), 22332321 (Boulder).
The background x-ray flux is at the class B5 level.
At midnight there were 7 spotted regions on the visible disk. Solar flare activity was low. A total of 10 C class events were recorded during the day. A region behind the southwest limb produced a C6.4 flare at 06:36 UTC. With the exception of the flare in region 10251 the remaining flare were all low level C events and optically unaccounted.
Region 10247 decayed quickly and quietly. At the current rate of decay this region will become spotless before reaching
the west limb.
Region 10250 was mostly quiet and generally unchanged.
Region 10251 decayed quickly in the trailing spot section. Additionally the large leading penumbra split off a smaller
penumbra at the tail end. Flare: C1.2 at 17:40 UTC.
Region 10254 decayed slowly and quietly.
Region 10255 was split off from region 10251 on January 12 by SEC/NOAA. This split was doubtful even then and it is
currently obvious that it was a premature decision.
Region 10256 was split off from region 10254 on January 12 by SEC/NOAA.
Regions 10254 and 10256 make up one bipolar region with the negative polarity area in the west and the main positive
area to the east. It remains to be seen if SEC will merge the "two" regions again.
Region 10257 decayed and could soon become spotless.
New region 10258 rotated into view near the northeast limb on January 13 and was numbered the next day.
New region 10259 rotated into view at the northeast limb.
January 12-14: No obviously geoeffective CMEs observed.
Coronal hole history (since late October 2002)
Compare today's report with the situation one solar rotation ago: 28
days ago 27 days ago 26 days ago
A coronal hole in the southern hemisphere could rotate into a geoeffective position on January 19-21.
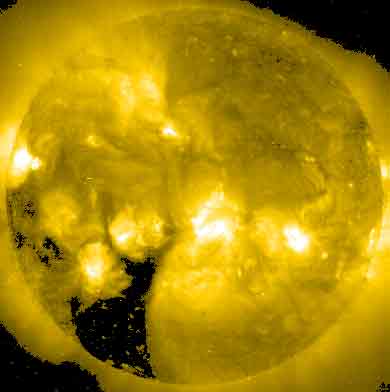
Processed SOHO EIT 284 image at 01:06 UTC on January 15. Any black areas on the solar disk are likely coronal holes.
The geomagnetic field is expected to be quiet to unsettled on January 15 and mostly quiet on January 16-18. Long distance medium wave (AM) band propagation along east-west paths over high and upper middle latitudes is fair.
| Coronal holes (1) | Coronal mass ejections (2) | M and X class flares (3) |
1) Effects from a coronal hole could reach Earth within the
next 5 days.
2) Material from a CME is likely to impact Earth within 96 hours.
3) There is a possibility of either M or X class flares within the next 48
hours.
Green: 0-20% probability, Yellow: 20-60% probability, Red: 60-100% probability.
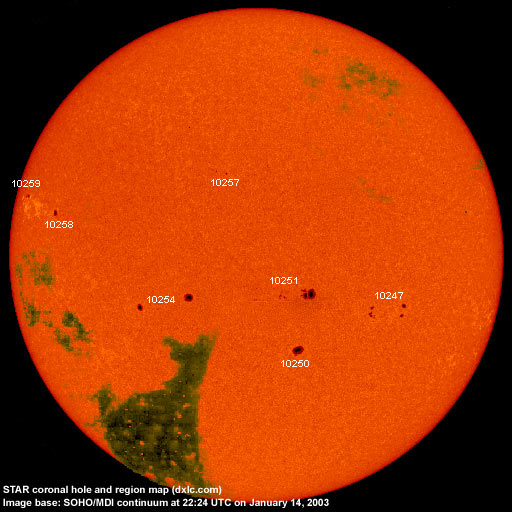
Composite image based on a SOHO/MDI continuum image and overlaid by a coronal hole image. Region numbering has been included. Compare to the previous day's image.
Data for all numbered solar regions according to the Solar Region Summary provided by SEC/NOAA. Comments are my own, as is the STAR spot count (spots observed at or inside a few hours before midnight) and data for regions not numbered by SEC or where SEC has observed no spots.
| Solar region | Date numbered | SEC spot count |
STAR spot count |
Location at midnight | Area | Classification | Comment |
|---|---|---|---|---|---|---|---|
| 10245 | 2003.01.03 | N12W72 | |||||
| 10247 | 2003.01.06 | 20 | 16 | S17W33 | 0150 | EAO |
classification was DAO at midnight, area 0100 |
| 10249 | 2003.01.07 | 1 | S15W76 | 0010 | AXX | now spotless | |
| 10250 | 2003.01.07 | 12 | 5 | S26W12 | 0170 | CAO | |
| 10251 | 2003.01.07 | 16 | 19 | S14W07 (SEC: S14W05) |
0070 | DAO |
beta-gamma classification was FAO at midnight, area 0270, region 10255 included |
| 10252 | 2003.01.09 | S03W08 | plage | ||||
| 10254 | 2003.01.10 | 6 | 5 | S15E24 (SEC: S14E17) |
0110 | CSO |
location corrected, classification was EAO at midnight, area 0140. STAR spot count includes region 10256. Only negative polarity spots in leading section |
| 10255 | 2003.01.12 | 7 | S13W12 | 0240 | CKO |
split off from region 10251 |
|
| 10256 | 2003.01.12 | 1 | S16E28 | 0060 | HSX |
split off from region 10254. A single positive polarity spot. |
|
| 10257 | 2003.01.13 | 6 | 4 | N16E09 | 0020 | CSO | |
| 10258 | 2003.01.14 | 5 | 4 | N07E56 | 0050 | CAO |
formerly region S74 classification was HAX at midnight |
| 10259 | 2003.01.14 | 2 | 4 | N13E72 | 0050 | HAX | |
| S72 | emerged on 2003.01.10 |
N07W85 | plage | ||||
| S73 | emerged on 2003.01.13 |
S21W43 | plage | ||||
| Total spot count: | 76 | 57 | |||||
| SSN: | 176 | 127 | |||||
| Month | Average solar flux at Earth |
International sunspot number | Smoothed sunspot number |
|---|---|---|---|
| 2000.04 | 184.2 | 125.5 | 120.8 cycle 23 sunspot max. |
| 2000.07 | 202.3 | 170.1 | 119.8 |
| 2001.12 | 235.1 | 132.2 | 114.6 (-0.9) |
| 2002.01 | 226.6 | 114.1 | 113.5 (-1.1) |
| 2002.02 | 205.0 | 107.4 | 114.6 (+1.2) |
| 2002.03 | 179.5 | 98.4 | 113.3 (-1.3) |
| 2002.04 | 189.8 | 120.7 | 110.5 (-2.9) |
| 2002.05 | 178.4 | 120.8 | 108.8 (-1.7) |
| 2002.06 | 148.7 | 88.3 | 106.2 (-2.6) |
| 2002.07 | 173.5 | 99.6 | (102.1 predicted, -4.1) |
| 2002.08 | 183.6 | 116.4 | (98.5 predicted, -3.6) |
| 2002.09 | 175.8 | 109.6 | (95.5 predicted, -3.0) |
| 2002.10 | 167.0 | 97.5 | (92.0 predicted, -3.5) |
| 2002.11 | 168.7 | 95.0 | (86.7 predicted, -5.3) |
| 2002.12 | 157.2 | 81.6 | (82.4 predicted, -4.3) |
| 2003.01 | 159.0 (1) | 72.4 (2) | (79.4 predicted, -3.0) |
1) Running average based on the daily 20:00 UT observed solar flux value at 2800
MHz.
2) Unofficial, accumulated value based on the Boulder (SEC/NOAA) sunspot number. The official
international sunspot number is typically 25-45% less.
This report has been prepared by Jan Alvestad. It is based partly on my own observations and interpretations, and partly on data from sources noted in solar links. All time references are to the UTC day. Comments and suggestions are always welcome.
| [DX-Listeners' Club] |