
Last update issued on February 20, 2003 at 01:00 UTC.
[Solar and geomagnetic data
- last 4 weeks (updated daily)]
[Solar wind and electron
fluence charts (updated daily)]
[Solar cycles 21-23 (last
update February 2, 2003)]
[Solar cycles 1-20]
[Graphical comparison of
cycles 21, 22 and 23 (last update February 2, 2003)]
[Graphical comparison of
cycles 10, 13, 17, 20 and 23 (last update February 2, 2003)]
[Historical solar and geomagnetic
data charts 1954-2002 (last update January 27, 2003)]
[Archived reports (last update February 17, 2003)]
The geomagnetic field was quiet to unsettled on February 19. Solar wind speed ranged between 489 and 648 km/sec at SOHO. A high speed stream began to dominate the solar wind again.
Solar flux measured at 20h UTC on 2.8 GHz was 116.3. The planetary A
index was 12 (STAR Ap - based on the mean of three hour interval ap indices: 12.8).
Three hour interval K indices: 33323333 (planetary), 23323323 (Boulder).
The background x-ray flux is at the class B3 level.
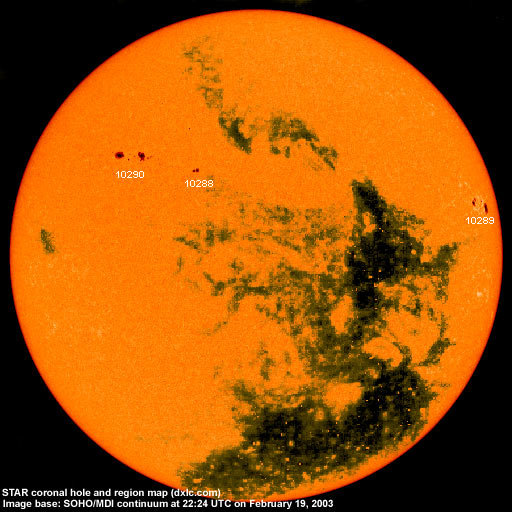
At midnight there were 3 spotted regions on the visible disk. Solar flare activity was low. A total of 2 C class events were recorded during the day.
Region 10288 was mostly unchanged and quiet.
Region 10289 developed moderately quickly and may soon become capable of producing a minor M class flare.
Region 10290 developed quickly with strong penumbral growth in both polarities. Flares:
C1.8 at 14:37 and C1.7 at 22:32 UTC. The latter event triggered a filament eruption north of region 10288.
February 17-19: No obviously geoeffective CMEs observed.
Coronal hole history (since late October 2002)
Compare today's report with the situation one solar rotation ago: 28
days ago 27 days ago 26
days ago
A small trans equatorial coronal hole could rotate into a geoeffective position on February 24.
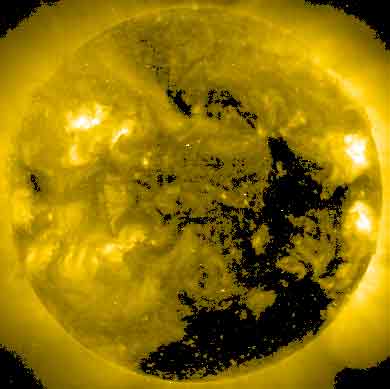
Processed SOHO EIT 284 image at 13:06 UTC on February 19. Any black areas on the solar disk are likely coronal holes.
The geomagnetic field is expected to be quiet to active until February 21. Long distance medium wave (AM) band propagation along east-west paths over high and upper middle latitudes is very poor, propagation along north-south paths is fair.
| Coronal holes (1) | Coronal mass ejections (2) | M and X class flares (3) |
1) Effects from a coronal hole could reach Earth within the
next 5 days.
2) Material from a CME is likely to impact Earth within 96 hours.
3) There is a possibility of either M or X class flares within the next 48
hours.
Green: 0-20% probability, Yellow: 20-60% probability, Red: 60-100% probability.
Compare to the previous day's image.
Data for all numbered solar regions according to the Solar Region Summary provided by SEC/NOAA. Comments are my own, as is the STAR spot count (spots observed at or inside a few hours before midnight) and data for regions not numbered by SEC or where SEC has observed no spots.
| Solar region | Date numbered | SEC spot count |
STAR spot count |
Location at midnight | Area | Classification | Comment |
|---|---|---|---|---|---|---|---|
| 10285 | 2003.02.08 | S12W66 | plage | ||||
| 10288 | 2003.02.15 | 4 | 3 | N13E15 | 0020 | HSX | area 0040 at midnight |
| 10289 | 2003.02.18 | 10 | 13 | N09W66 | 0140 | DKO | |
| 10290 | 2003.02.18 | 13 | 22 | N18E31 | 0080 | DSO |
beta-gamma classification was DAO at midnight, area 0200 |
| S100 | emerged on 2003.02.13 |
N11W43 | plage | ||||
| S101 | emerged on 2003.02.15 |
S03W65 | plage | ||||
| S102 | emerged on 2003.02.15 |
S08W12 | plage | ||||
| Total spot count: | 27 | 38 | |||||
| SSN: | 57 | 68 | |||||
| Month | Average solar flux at Earth |
International sunspot number | Smoothed sunspot number |
|---|---|---|---|
| 2000.04 | 184.2 | 125.5 | 120.8 cycle 23 sunspot max. |
| 2000.07 | 202.3 | 170.1 | 119.8 |
| 2001.12 | 235.1 | 132.2 | 114.6 (-0.9) |
| 2002.01 | 226.6 | 114.1 | 113.5 (-1.1) |
| 2002.02 | 205.0 | 107.4 | 114.6 (+1.2) |
| 2002.03 | 179.5 | 98.4 | 113.3 (-1.3) |
| 2002.04 | 189.8 | 120.7 | 110.5 (-2.9) |
| 2002.05 | 178.4 | 120.8 | 108.8 (-1.7) |
| 2002.06 | 148.7 | 88.3 | 106.2 (-2.6) |
| 2002.07 | 173.5 | 99.6 | 102.7 (-3.5) |
| 2002.08 | 183.6 | 116.4 | (99.7 predicted, -3.0) |
| 2002.09 | 175.8 | 109.6 | (96.7 predicted, -3.0) |
| 2002.10 | 167.0 | 97.5 | (93.2 predicted, -3.5) |
| 2002.11 | 168.7 | 95.0 | (88.0 predicted, -5.2) |
| 2002.12 | 157.2 | 81.6 | (83.6 predicted, -4.4) |
| 2003.01 | 144.0 | 79.5 | (80.6 predicted, -3.0) |
| 2003.02 | 130.7 (1) | 68.7 (2) | (75.5 predicted, -5.1) |
1) Running average based on the daily 20:00 UT observed solar flux value at 2800
MHz.
2) Unofficial, accumulated value based on the Boulder (SEC/NOAA) sunspot number. The official
international sunspot number is typically 25-45% less.
This report has been prepared by Jan Alvestad. It is based partly on my own observations and interpretations, and partly on data from sources noted in solar links. All time references are to the UTC day. Comments and suggestions are always welcome.
| [DX-Listeners' Club] |