
Last update issued on January 23, 2003 at 04:00 UTC. Minor update posted at 07:41 UTC.
[Solar and geomagnetic data
- last 4 weeks (updated daily)]
[Solar wind and electron
fluence charts (updated daily)]
[Solar cycles 21-23 (last
update January 1, 2003)]
[Solar cycles 1-20]
[Graphical comparison of
cycles 21, 22 and 23 (last update January 1, 2003)]
[Graphical comparison of
cycles 10, 13, 17, 20 and 23 (last update January 1, 2003)]
[Historical solar and geomagnetic
data charts 1954-2002 (last update October 13, 2002)]
[Archived reports (last update January 20, 2003)]
The geomagnetic field was unsettled to minor storm on January 22. Solar wind speed ranged between 498 and 693 km/sec under the influence of a strong coronal stream.
Solar flux measured at 20h UTC on 2.8 GHz was 129.5. The planetary A
index was 17 (STAR Ap - based on the mean of three hour interval ap indices: 18.4).
Three hour interval K indices: 33333335 (planetary), 33332425 (Boulder).
The background x-ray flux is at the class B3 level.
At midnight there were 8 spotted regions on the visible disk, 1 of which has not yet been numbered by SEC/NOAA. Solar flare activity was moderate. A total of 1 C and 1 M class events were recorded.
Region 10258 decayed slowly and quietly.
Region 10260 decayed quickly and could soon become spotless. Flare: M1.2/1F at 04:44 UTC.
Region 10263 was quiet and stable.
Region 10266 decayed slowly and was mostly quiet. Flare: A long duration C1.6 event
peaking at 13:24 UTC.
Region 10267 developed slowly and could produce C class flares.
Region 10268 developed significantly and could soon become the largest region on the visible disk. The inversion line is
aligned in a southwest-northeast direction and a magnetic delta structure has formed. Minor M class flares are becoming possible.
Region 10269 decayed slowly as the two main penumbrae separated. There is still a chance of a minor M class flare.
Spotted regions not yet numbered by SEC/NOAA:
[S79] A new region emerged very quickly in the southwest quadrant a few degrees west of region 10263 on January 21. The
region decayed slowly on January 22 and could be merging with region 10263. Location at midnight. S14W56.
Comment added at 07:41 UTC on January 23: Region 10266 generated an M1.0 flare at 04:48 UTC (and a C6.0 flare at 04:34 UTC). Type II radio sweeps were associated with the flares. Prior to those events positive polarity flux had emerged quickly just northeast of the main (leading) negative polarity area. The region currently has mixed polarities and further flaring is possible. Region S79 is another region which has become more complex this morning. A positive polarity area has emerged at the southeastern edge of the main negative polarity area. This has created a magnetic delta structure and the region could produce M class flares. So far the region has produced a C4.5 flare at 02:19 UTC.
January 20: A filament eruption in the northeast quadrant began at approximately 19h UTC with its southwesternmost extension reaching nearly to region 10260. A slowly expanding, bright CME was observed over the northeast limb as early as 19:42 UTC in LASCO C3 images. Early on January 21 this CME became a partial halo CME as it extended south of the equator at the east limb and into the northwest limb. The CME is probably not geoeffective.
January 21: A large CME was observed off of the southeast limb after the M1.9 event in region 10269. The CME is unlikely to be geoeffective.
January 22: No obviously geoeffective CMEs observed.
Coronal hole history (since late October 2002)
Compare today's report with the situation one solar rotation ago: 28
days ago 27 days ago 26 days ago
A huge trans equatorial extension of the southern polar coronal hole was in a geoeffective position on January 16-23.
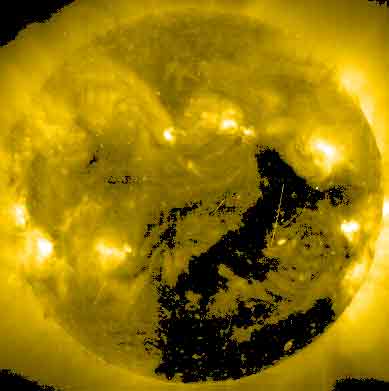
Processed SOHO EIT 284 image at 01:06 UTC on January 23. Any black areas on the solar disk are likely coronal holes.
The geomagnetic field is expected to be unsettled to minor storm until January 26 due to a coronal stream. Quiet to active is expected on January 27 while quiet to unsettled is likely on January 28-29. Long distance medium wave (AM) band propagation along east-west paths over high and upper middle latitudes is poor to very poor.
| Coronal holes (1) | Coronal mass ejections (2) | M and X class flares (3) |
1) Effects from a coronal hole could reach Earth within the
next 5 days.
2) Material from a CME is likely to impact Earth within 96 hours.
3) There is a possibility of either M or X class flares within the next 48
hours.
Green: 0-20% probability, Yellow: 20-60% probability, Red: 60-100% probability.
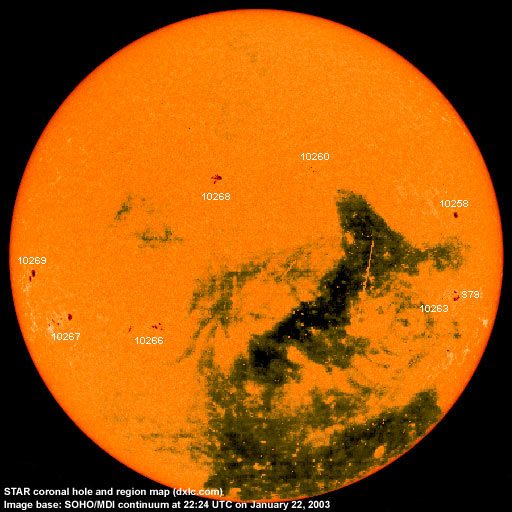
Composite image based on a SOHO/MDI continuum image and overlaid by a coronal hole image. Region numbering has been included. Compare to the previous day's image.
Data for all numbered solar regions according to the Solar Region Summary provided by SEC/NOAA. Comments are my own, as is the STAR spot count (spots observed at or inside a few hours before midnight) and data for regions not numbered by SEC or where SEC has observed no spots.
| Solar region | Date numbered | SEC spot count |
STAR spot count |
Location at midnight | Area | Classification | Comment |
|---|---|---|---|---|---|---|---|
| 10254 | 2003.01.10 | 1 | S14W90 | 0060 | HSX | rotated out of view | |
| 10256 | 2003.01.12 | S16W78 | plage | ||||
| 10258 | 2003.01.14 | 1 | 1 | N07W54 | 0060 | HSX | |
| 10259 | 2003.01.14 | 3 | N10W34 | 0010 | BXO | now spotless | |
| 10260 | 2003.01.15 | 12 | 4 | N14W13 | 0040 | DSO |
classification was BXO at midnight, area 0020 |
| 10261 | 2003.01.19 | N26W86 | plage | ||||
| 10262 | 2003.01.19 | S05W86 | plage | ||||
| 10263 | 2003.01.19 | 8 | 1 | S13W51 (SEC: S13W53) |
0060 | DSO |
location corrected SEC has apparently merged two separate regions (see S79). classification was AXX at midnight, area 0000 |
| 10264 | 2003.01.20 | S20W28 | plage | ||||
| 10265 | 2003.01.20 | N04E05 | plage | ||||
| 10266 | 2003.01.20 | 16 | 15 | S23E30 | 0080 | ESO |
classification was DAO at midnight |
| 10267 | 2003.01.20 | 10 | 11 | S20E51 | 0150 | EAO |
classification was DAO at midnight, area 0090 |
| 10268 | 2003.01.21 | 9 | 20 | N12E10 | 0030 | CAO |
beta-delta classification was DAI at midnight, area 0100 |
| 10269 | 2003.01.21 | 2 | 3 | S09E63 | 0110 | DSO | |
| S79 | emerged on 2003.01.21 |
9 | S13W56 | 0060 | DAO | ||
| Total spot count: | 62 | 64 | |||||
| SSN: | 152 | 144 | |||||
| Month | Average solar flux at Earth |
International sunspot number | Smoothed sunspot number |
|---|---|---|---|
| 2000.04 | 184.2 | 125.5 | 120.8 cycle 23 sunspot max. |
| 2000.07 | 202.3 | 170.1 | 119.8 |
| 2001.12 | 235.1 | 132.2 | 114.6 (-0.9) |
| 2002.01 | 226.6 | 114.1 | 113.5 (-1.1) |
| 2002.02 | 205.0 | 107.4 | 114.6 (+1.2) |
| 2002.03 | 179.5 | 98.4 | 113.3 (-1.3) |
| 2002.04 | 189.8 | 120.7 | 110.5 (-2.9) |
| 2002.05 | 178.4 | 120.8 | 108.8 (-1.7) |
| 2002.06 | 148.7 | 88.3 | 106.2 (-2.6) |
| 2002.07 | 173.5 | 99.6 | (102.1 predicted, -4.1) |
| 2002.08 | 183.6 | 116.4 | (98.5 predicted, -3.6) |
| 2002.09 | 175.8 | 109.6 | (95.5 predicted, -3.0) |
| 2002.10 | 167.0 | 97.5 | (92.0 predicted, -3.5) |
| 2002.11 | 168.7 | 95.0 | (86.7 predicted, -5.3) |
| 2002.12 | 157.2 | 81.6 | (82.4 predicted, -4.3) |
| 2003.01 | 151.4 (1) | 113.6 (2) | (79.4 predicted, -3.0) |
1) Running average based on the daily 20:00 UT observed solar flux value at 2800
MHz.
2) Unofficial, accumulated value based on the Boulder (SEC/NOAA) sunspot number. The official
international sunspot number is typically 25-45% less.
This report has been prepared by Jan Alvestad. It is based partly on my own observations and interpretations, and partly on data from sources noted in solar links. All time references are to the UTC day. Comments and suggestions are always welcome.
| [DX-Listeners' Club] |