
Last update issued on February 22, 2003 at 04:10 UTC.
[Solar and geomagnetic data
- last 4 weeks (updated daily)]
[Solar wind and electron
fluence charts (updated daily)]
[Solar cycles 21-23 (last
update February 2, 2003)]
[Solar cycles 1-20]
[Graphical comparison of
cycles 21, 22 and 23 (last update February 2, 2003)]
[Graphical comparison of
cycles 10, 13, 17, 20 and 23 (last update February 2, 2003)]
[Historical solar and geomagnetic
data charts 1954-2002 (last update January 27, 2003)]
[Archived reports (last update February 17, 2003)]
The geomagnetic field was quiet to active on February 20. Solar wind speed ranged between 501 and 639 km/sec, generally decreasing as Earth is slowly moving out of a week long high speed stream.
Solar flux measured at 20h UTC on 2.8 GHz was 119.6. The planetary A
index was 13 (STAR Ap - based on the mean of three hour interval ap indices: 13.9).
Three hour interval K indices: 23322443 (planetary), 14322432 (Boulder).
The background x-ray flux is at the class B4 level.
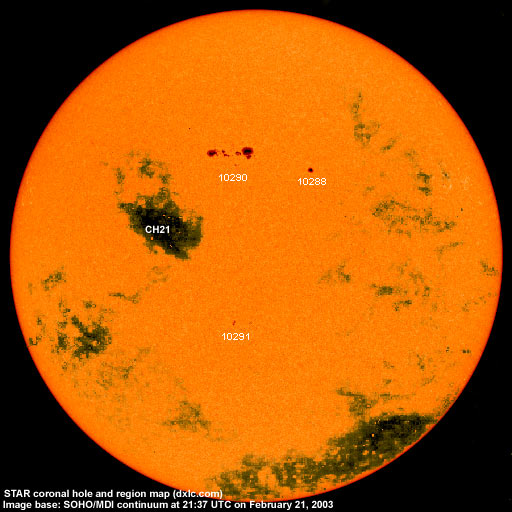
At midnight there were 3 spotted regions on the visible disk. Solar flare activity was low. A total of 10 C class events was recorded during the day. Region 10289 at the northwest limb produced a C1.6 flare at 02:34, a C1.8 flare at 06:17, a C2.1 flare at 07:17, a C1.3 flare at 12:55 and a C1.1 flare at 15:51 UTC.
Region 10288 decayed slowly and lost the trailing spots.
Region 10290 developed some intermediate spots, however, both the large leading and trailing penumbrae lost some area.
Additionally the leading penumbra split off a smaller penumbrae at its southern edge while a small negative polarity spot moved
away from the southwestern edge. M class flares are possible. Flares: C2.5 at 02:00, C1.6 at
05:06, C1.0 at 11:22, C3.7 at 15:14 and C4.3 at 19:50 UTC.
New region 10291 emerged on February 21 in the southeast quadrant and was numbered the next day. The region is currently
decaying.
February 19-21: No obviously geoeffective CMEs observed.
Coronal hole history (since late October 2002)
Compare today's report with the situation one solar rotation ago: 28
days ago 27 days ago 26
days ago
A recurrent, trans equatorial coronal hole will rotate into a geoeffective position on February 23-24.
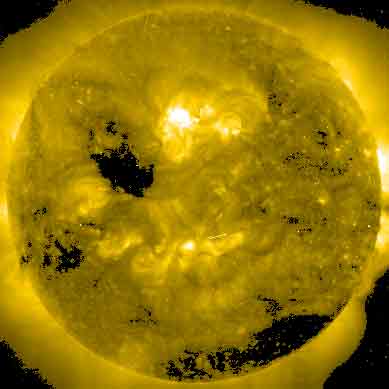
Processed SOHO EIT 284 image at 01:06 UTC on February 22. Any black areas on the solar disk are likely coronal holes.
The geomagnetic field is expected to be quiet to unsettled on February 22-24. A high speed stream originating in CH21 will likely cause a disturbance on February 26-27 with the geomagnetic field becoming unsettled to active. Long distance medium wave (AM) band propagation along east-west paths over high and upper middle latitudes is poor and slowly improving, propagation along north-south paths is fair. [Propagation conditions are currently monitored every night. Main monitoring frequency: 1470 kHz. Dominant station tonight: none, several stations heard including Radio Vibraci�n, Radio Cristal del Uruguay, unidentified stations from Brazil and WMTW (WLAM)]
| Coronal holes (1) | Coronal mass ejections (2) | M and X class flares (3) |
1) Effects from a coronal hole could reach Earth within the
next 5 days.
2) Material from a CME is likely to impact Earth within 96 hours.
3) There is a possibility of either M or X class flares within the next 48
hours.
Green: 0-20% probability, Yellow: 20-60% probability, Red: 60-100% probability.
Compare to the previous day's image.
Data for all numbered solar regions according to the Solar Region Summary provided by SEC/NOAA. Comments are my own, as is the STAR spot count (spots observed at or inside a few hours before midnight) and data for regions not numbered by SEC or where SEC has observed no spots.
| Solar region | Date numbered | SEC spot count |
STAR spot count |
Location at midnight | Area | Classification | Comment |
|---|---|---|---|---|---|---|---|
| 10288 | 2003.02.15 | 6 | 1 | N13W10 | 0060 | CSO |
classification was HSX at midnight, area 0050 |
| 10289 | 2003.02.18 | 5 | N09W91 | 0080 | DSO | rotated out of view | |
| 10290 | 2003.02.18 | 29 | 25 | N17E05 | 0360 | EKI | beta-gamma |
| 10291 | 2003.02.21 | 7 | 4 | S23E03 | 0020 | CSO |
formerly region S104 classification was CRO at midnight |
| S100 | emerged on 2003.02.13 |
N11W69 | plage | ||||
| S102 | emerged on 2003.02.15 |
S08W38 | plage | ||||
| S105 | emerged on 2003.02.20 |
S28W03 | now spotless | ||||
| Total spot count: | 47 | 30 | |||||
| SSN: | 87 | 60 | |||||
| Month | Average solar flux at Earth |
International sunspot number | Smoothed sunspot number |
|---|---|---|---|
| 2000.04 | 184.2 | 125.5 | 120.8 cycle 23 sunspot max. |
| 2000.07 | 202.3 | 170.1 | 119.8 |
| 2001.12 | 235.1 | 132.2 | 114.6 (-0.9) |
| 2002.01 | 226.6 | 114.1 | 113.5 (-1.1) |
| 2002.02 | 205.0 | 107.4 | 114.6 (+1.2) |
| 2002.03 | 179.5 | 98.4 | 113.3 (-1.3) |
| 2002.04 | 189.8 | 120.7 | 110.5 (-2.9) |
| 2002.05 | 178.4 | 120.8 | 108.8 (-1.7) |
| 2002.06 | 148.7 | 88.3 | 106.2 (-2.6) |
| 2002.07 | 173.5 | 99.6 | 102.7 (-3.5) |
| 2002.08 | 183.6 | 116.4 | (99.7 predicted, -3.0) |
| 2002.09 | 175.8 | 109.6 | (96.7 predicted, -3.0) |
| 2002.10 | 167.0 | 97.5 | (93.2 predicted, -3.5) |
| 2002.11 | 168.7 | 95.0 | (88.0 predicted, -5.2) |
| 2002.12 | 157.2 | 81.6 | (83.6 predicted, -4.4) |
| 2003.01 | 144.0 | 79.5 | (80.6 predicted, -3.0) |
| 2003.02 | 129.5 (1) | 74.1 (2) | (75.5 predicted, -5.1) |
1) Running average based on the daily 20:00 UT observed solar flux value at 2800
MHz.
2) Unofficial, accumulated value based on the Boulder (SEC/NOAA) sunspot number. The official
international sunspot number is typically 25-45% less.
This report has been prepared by Jan Alvestad. It is based partly on my own observations and interpretations, and partly on data from sources noted in solar links. All time references are to the UTC day. Comments and suggestions are always welcome.
| [DX-Listeners' Club] |