
Last update issued on January 27, 2003 at 03:40 UTC.
[Solar and geomagnetic data
- last 4 weeks (updated daily)]
[Solar wind and electron
fluence charts (updated daily)]
[Solar cycles 21-23 (last
update January 1, 2003)]
[Solar cycles 1-20]
[Graphical comparison of
cycles 21, 22 and 23 (last update January 1, 2003)]
[Graphical comparison of
cycles 10, 13, 17, 20 and 23 (last update January 1, 2003)]
[Historical solar and geomagnetic
data charts 1954-2002 (last update January 27, 2003)]
[Archived reports (last update January 20, 2003)]
The geomagnetic field was quiet to active on January 26. Solar wind speed ranged between 560 and 770 km/sec under the influence of a strong coronal stream. The coronal stream weakened considerably towards the end of the day.
Solar flux measured at 20h UTC on 2.8 GHz was 125.0. The planetary A
index was 17 (STAR Ap - based on the mean of three hour interval ap indices: 17.1).
Three hour interval K indices: 43444332 (planetary), 34433323 (Boulder).
The background x-ray flux is at the class B3 level.
At midnight there were 8 spotted regions on the visible disk, 1 of which has not yet been numbered by SEC/NOAA. Solar flare activity was low. Only 1 C class event was recorded.
Region 10266 decayed slowly and quietly.
Region 10267 decayed slowly and quietly.
Region 10268 decayed fairly quickly losing penumbral area in both the leading and trailing penumbrae. Flare:
C2.6 at 10:40 UTC.
Region 10269 was mostly unchanged and quiet.
New region 10270 emerged in the southwest quadrant.
New region 10271 emerged in the southwest quadrant due east of region 10270.
New region 10272 emerged in the southeast quadrant on January 25 and was numbered the next day.
Spotted regions not yet numbered by SEC:
[S81] A new region emerged late on January 26 in the northwest quadrant near the center of the visible disk. Location at midnight:
N05W04.
January 25-26: No obviously geoeffective CMEs observed.
Coronal hole history (since late October 2002)
Compare today's report with the situation one solar rotation ago: 28
days ago 27 days ago 26 days ago
A small trans equatorial coronal hole was in a geoeffective position on January 26-27. Another coronal hole in the northern hemisphere will probably become geoeffective on January 29-30.
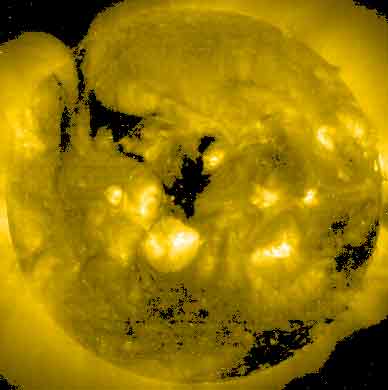
Processed SOHO EIT 284 image at 01:06 UTC on January 27. Any black areas on the solar disk are likely coronal holes.
The geomagnetic field is expected to be quiet to unsettled on January 27-28 and most of January 29. Quiet to active is likely from late on January 29 until January 31. Long distance medium wave (AM) band propagation along east-west paths over high and upper middle latitudes is poor to very poor.
| Coronal holes (1) | Coronal mass ejections (2) | M and X class flares (3) |
1) Effects from a coronal hole could reach Earth within the
next 5 days.
2) Material from a CME is likely to impact Earth within 96 hours.
3) There is a possibility of either M or X class flares within the next 48
hours.
Green: 0-20% probability, Yellow: 20-60% probability, Red: 60-100% probability.
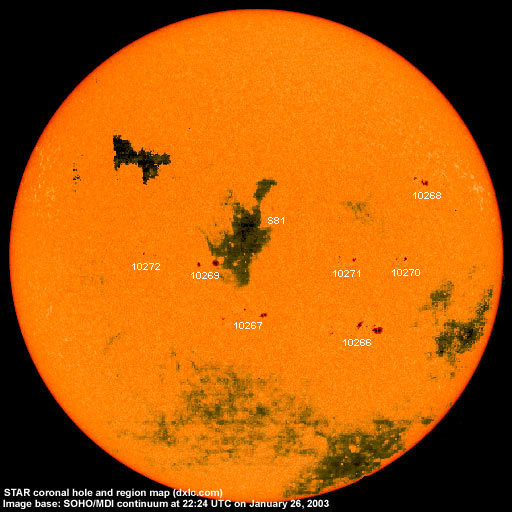
Composite image based on a SOHO/MDI continuum image and overlaid by a coronal hole image. Region numbering has been included. Compare to the previous day's image.
Data for all numbered solar regions according to the Solar Region Summary provided by SEC/NOAA. Comments are my own, as is the STAR spot count (spots observed at or inside a few hours before midnight) and data for regions not numbered by SEC or where SEC has observed no spots.
| Solar region | Date numbered | SEC spot count |
STAR spot count |
Location at midnight | Area | Classification | Comment |
|---|---|---|---|---|---|---|---|
| 10259 | 2003.01.14 | N10W86 | plage | ||||
| 10260 | 2003.01.15 | 1 | N15W67 | 0000 | AXX | spotless since Jan.24 | |
| 10264 | 2003.01.20 | S20W80 | plage | ||||
| 10265 | 2003.01.20 | N04W47 | plage | ||||
| 10266 | 2003.01.20 | 21 | 21 | S22W26 | 0170 | FAI | beta-gamma |
| 10267 | 2003.01.20 | 12 | 17 | S20E03 | 0100 | DAO | |
| 10268 | 2003.01.21 | 6 | 6 | N15W42 | 0100 | DSO | reversed polarity |
| 10269 | 2003.01.21 | 3 | 5 | S07E12 | 0080 | DSO |
classification was HSX at midnight, only negative polarity spots |
| 10270 | 2003.01.26 | 3 | 3 | S04W36 | 0040 | DSO |
classification was DAO at midnight |
| 10271 | 2003.01.26 | 4 | 5 | S06W21 | 0020 | CSO |
classification was CAO at midnight |
| 10272 | 2003.01.26 | 3 | 4 | S05E26 | 0030 | DSO |
formerly region S80 classification was CSO at midnight |
| S81 | emerged on 2003.01.26 |
6 | N05W04 | 0020 | BXO | ||
| Total spot count: | 53 | 67 | |||||
| SSN: | 133 | 147 | |||||
| Month | Average solar flux at Earth |
International sunspot number | Smoothed sunspot number |
|---|---|---|---|
| 2000.04 | 184.2 | 125.5 | 120.8 cycle 23 sunspot max. |
| 2000.07 | 202.3 | 170.1 | 119.8 |
| 2001.12 | 235.1 | 132.2 | 114.6 (-0.9) |
| 2002.01 | 226.6 | 114.1 | 113.5 (-1.1) |
| 2002.02 | 205.0 | 107.4 | 114.6 (+1.2) |
| 2002.03 | 179.5 | 98.4 | 113.3 (-1.3) |
| 2002.04 | 189.8 | 120.7 | 110.5 (-2.9) |
| 2002.05 | 178.4 | 120.8 | 108.8 (-1.7) |
| 2002.06 | 148.7 | 88.3 | 106.2 (-2.6) |
| 2002.07 | 173.5 | 99.6 | (102.1 predicted, -4.1) |
| 2002.08 | 183.6 | 116.4 | (98.5 predicted, -3.6) |
| 2002.09 | 175.8 | 109.6 | (95.5 predicted, -3.0) |
| 2002.10 | 167.0 | 97.5 | (92.0 predicted, -3.5) |
| 2002.11 | 168.7 | 95.0 | (86.7 predicted, -5.3) |
| 2002.12 | 157.2 | 81.6 | (82.4 predicted, -4.3) |
| 2003.01 | 148.1 (1) | 129.4 (2) | (79.4 predicted, -3.0) |
1) Running average based on the daily 20:00 UT observed solar flux value at 2800
MHz.
2) Unofficial, accumulated value based on the Boulder (SEC/NOAA) sunspot number. The official
international sunspot number is typically 25-45% less.
This report has been prepared by Jan Alvestad. It is based partly on my own observations and interpretations, and partly on data from sources noted in solar links. All time references are to the UTC day. Comments and suggestions are always welcome.
| [DX-Listeners' Club] |