
Last update January 8, 2003 at 03:25 UTC.
[Solar and geomagnetic data
- last 4 weeks (updated daily)]
[Solar wind and electron
fluence charts (updated daily)]
[Solar cycles 21-23 (last
update January 1, 2003)]
[Solar cycles 1-20]
[Graphical comparison of
cycles 21, 22 and 23 (last update January 1, 2003)]
[Graphical comparison of
cycles 10, 13, 17, 20 and 23 (last update January 1, 2003)]
[Historical solar and geomagnetic
data charts 1954-2002 (last update October 13, 2002)]
[Archived reports (last update January 6, 2003)]
The geomagnetic field was quiet to unsettled on January 7. Solar wind speed ranged between 311 and 393 km/sec.
Solar flux measured at 20h UTC on 2.8 GHz was 163.2. The planetary A
index was 9 (STAR Ap - based on the mean of three hour interval ap indices: 10.0).
Three hour interval K indices: 23232232 (planetary), 12332222 (Boulder).
The background x-ray flux is at the class B8 level.
At midnight there were 8 spotted regions on the visible disk. Solar flare activity was moderate. A total of 10 C and 2 M class events were recorded during the day.
Region 10239 rotated out of view at the southwest limb. Flares: C2.3 at 09:36, C2.8 at
17:36 and C1.6 at 19:36 UTC.
Region 10242 decayed slightly in the northern spot sections while development was observed in the southeastern spot
section. A weak magnetic delta has formed in the westernmost part of this southeastern spot section. The region could produce an M
class flare. Flare: C7.7 at 08:33 UTC.
Region 10244 developed slowly early in the day, then decayed after the M flare. Flares:
C2.1 at 00:12 and M1.0/1F long duration event peaking at 07:50 UTC.
Region 10245 decayed slowly and quietly.
Region 10247 developed several trailing spots and more than doubled the size of the leading penumbra. C flares are
possible.
New region 10248 emerged in the southwest quadrant.
New region 10249 emerged in the southeastern quadrant on January 4, became spotless on January 5, then reemerged with spots
late on January 7 and was numbered the next day.
New region 10250 rotated into view at the southeast limb. Flare: C2.8 long duration
event peaking at 11:05 UTC.
New region 10251 rotated into view at the southeast limb, further north than region 10250. The region could produce further
M class flares, possibly even a major flare. There appears to be a magnetic delta structure at the northeastern edge of the
leading penumbra. Flare: C3.5 at 02:34 and M4.9 at 23:33 UTC.
January 5-7: No obviously geoeffective CMEs observed.
Coronal hole history (since late October 2002)
Compare today's report with the situation one solar rotation ago: 28
days ago 27 days ago 26 days ago
A recurrent trans equatorial extension of the northern polar coronal hole was in a geoeffective position on January 6.
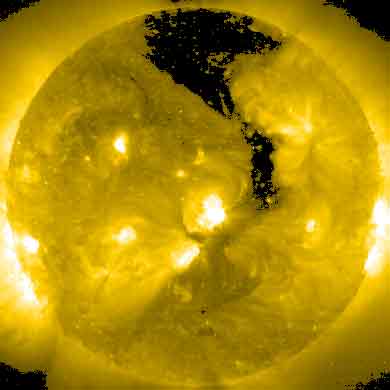
Processed SOHO EIT 284 image at 19:06 UTC on January 7. Any black areas on the solar disk are likely coronal holes.
The geomagnetic field is expected to be quiet to unsettled during the first half of January 8. A coronal stream will begin to influence the geomagnetic field during the latter half of the day and could cause unsettled to active conditions, perhaps even with minor storm intervals. Quiet to active is expected on January 9-10 with quiet to unsettled likely for January 11-12. Long distance medium wave (AM) band propagation along east-west paths over high and upper middle latitudes is fair.
| Coronal holes (1) | Coronal mass ejections (2) | M and X class flares (3) |
1) Effects from a coronal hole could reach Earth within the
next 5 days.
2) Material from a CME is likely to impact Earth within 96 hours.
3) There is a possibility of either M or X class flares within the next 48
hours.
Green: 0-20% probability, Yellow: 20-60% probability, Red: 60-100% probability.
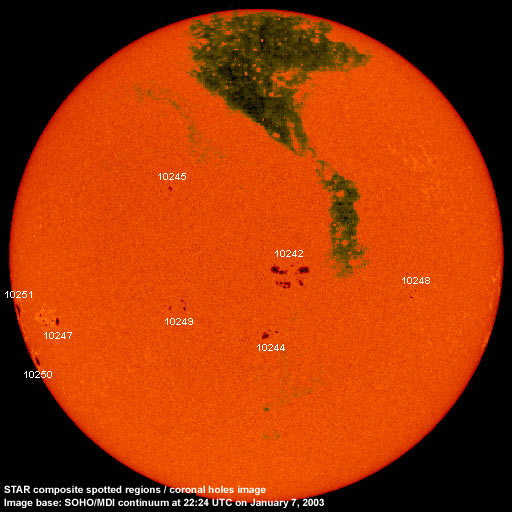
Composite image based on a SOHO/MDI continuum image and overlaid by a coronal hole image. Region numbering has been included. Compare to the previous day's image.
Data for all numbered solar regions according to the Solar Region Summary provided by SEC/NOAA. Comments are my own, as is the STAR spot count (spots observed at or inside a few hours before midnight) and data for regions not numbered by SEC or where SEC has observed no spots.
| Solar region | Date numbered | SEC spot count |
STAR spot count |
Location at midnight | Area | Classification | Comment |
|---|---|---|---|---|---|---|---|
| 10239 | 2002.12.29 | 1 | S09W89 (SEC: S08W82) |
0050 | HAX |
location corrected rotated out of view |
|
| 10240 | 2002.12.30 | 3 | S08W69 (SEC: S04W78) |
0030 | CSO |
actually spotless location corrected see region S66 below |
|
| 10242 | 2003.01.02 | 36 | 42 | S06W09 | 0340 | DKC |
beta-gamma-delta area approx. 0480 at midnight |
| 10243 | 2003.01.03 | 1 | S18W88 | 0060 | HAX | rotated out of view | |
| 10244 | 2003.01.03 | 15 | 13 | S23W01 | 0080 | DAO | |
| 10245 | 2003.01.03 | 3 | 4 | N12E21 | 0030 | CSO | |
| 10246 | 2003.01.06 | 1 | N09W02 | 0000 | AXX | now spotless | |
| 10247 | 2003.01.06 | 5 | 6 | S18E59 | 0070 | CAO |
classification was DAO at midnight |
| 10248 | 2003.01.07 | 4 | 6 | S11W41 | 0010 | CSO | |
| 10249 | 2003.01.07 | 7 | 7 | S16E18 | 0020 | CRO |
formerly region S67 classification was DSO at midnight, area 0040 |
| 10250 | 2003.01.07 | 2 | 1 | S27E79 | 0100 | HSX |
classification was HAX at midnight |
| 10251 | 2003.01.07 | 1 | 4 | S14E81 | 0060 | HAX |
beta-delta area was approx. 0170 at midnight |
| S66 | emerged on 2003.01.04 |
S05W77 | now spotless | ||||
| S68 | emerged on 2003.01.04 |
N02E06 | plage | ||||
| S69 | emerged on 2003.01.05 |
N13W25 | plage | ||||
| Total spot count: | 79 | 83 | |||||
| SSN: | 199 | 163 | |||||
| Month | Average solar flux at Earth |
International sunspot number | Smoothed sunspot number |
|---|---|---|---|
| 2000.04 | 184.2 | 125.5 | 120.8 cycle 23 sunspot max. |
| 2000.07 | 202.3 | 170.1 | 119.8 |
| 2001.12 | 235.1 | 132.2 | 114.6 (-0.9) |
| 2002.01 | 226.6 | 114.1 | 113.5 (-1.1) |
| 2002.02 | 205.0 | 107.4 | 114.6 (+1.2) |
| 2002.03 | 179.5 | 98.4 | 113.3 (-1.3) |
| 2002.04 | 189.8 | 120.7 | 110.5 (-2.9) |
| 2002.05 | 178.4 | 120.8 | 108.8 (-1.7) |
| 2002.06 | 148.7 | 88.3 | 106.2 (-2.6) |
| 2002.07 | 173.5 | 99.6 | (102.1 predicted, -4.1) |
| 2002.08 | 183.6 | 116.4 | (98.5 predicted, -3.6) |
| 2002.09 | 175.8 | 109.6 | (95.5 predicted, -3.0) |
| 2002.10 | 167.0 | 97.5 | (92.0 predicted, -3.5) |
| 2002.11 | 168.7 | 95.0 | (86.7 predicted, -5.3) |
| 2002.12 | 157.2 | 81.6 | (82.4 predicted, -4.3) |
| 2003.01 | 141.0 (1) | 26.3 (2) | (79.4 predicted, -3.0) |
1) Running average based on the daily 20:00 UT observed solar flux value at 2800
MHz.
2) Unofficial, accumulated value based on the Boulder (SEC/NOAA) sunspot number. The official
international sunspot number is typically 25-45% less.
This report has been prepared by Jan Alvestad. It is based partly on my own observations and interpretations, and partly on data from sources noted in solar links. All time references are to the UTC day. Comments and suggestions are always welcome.
| [DX-Listeners' Club] |