
Last update December 13, 2002 at 04:50 UTC.
[Solar and geomagnetic data
- last 4 weeks (updated daily)]
[Solar wind and electron
fluence charts (updated daily)]
[Solar cycles 21-23 (last
update December 2, 2002)]
[Solar cycles 1-20]
[Graphical comparison of
cycles 21, 22 and 23 (last update December 2, 2002)]
[Graphical comparison of
cycles 10, 13, 17, 20 and 23 (last update December 2, 2002)]
[Historical solar and geomagnetic
data charts 1954-2002 (last update October 13, 2002)]
[Archived reports (last update December 9, 2002)]
The geomagnetic field was quiet to unsettled on December 12. Solar wind speed ranged between 339 and 428 km/sec.
Solar flare activity was low. Solar flux was 153.1, the planetary A
index was 7 (STAR Ap - based on the mean of three hour ap indices: 8.1).
Three hour interval K indices: 22122322 (planetary), 12122222 (Boulder).
The background x-ray flux is at the class C1 level.
At midnight there were 8 spotted regions on the visible disk, 3 of which have not yet been numbered. A total of 13 C class flares were recorded during the day. Several low level optically unaccounted C flares are believed to have had their origin in region 10224 which displayed nearly continuous activity all day.
Region 10213 decayed and could become spotless again today.
Region 10215 decayed and was spotless by late evening.
Region 10218 developed several new spots and was quiet. Further development is likely as new positive flux emerged just
ahead of the leading negative polarity area.
Region 10220 decayed further and was mostly quiet.
New region 10223 rotated into view at the northeast limb late on December 11 and was numbered on Dec.12.
New region 10224 rotated into view at the southeast limb late on December 11 and was numbered on Dec.12. The region appears
to have the potential to produce minor M class flares. Flare: C4.1 at 08:17, C5.8 long
duration event peaking at 11:43, C8.3 at 12:39 UTC (there was activity in region 10220 at the same time and in region 10213 a few
minutes later, however, region 10224 in SOHO and LASCO images appears to have been the most likely candidate).
Spotted regions not yet numbered by SEC:
[S49] This region reemerged with a few spots on December 12. Location at midnight: S22W09.
[S53] A new region rotated into view at the northeast limb before noon on December 12. Location at midnight: N16E77.
[S54] A new region emerged in the southwest quadrant due south of region 10222. Unfortunately SEC/NOAA decided to reuse
that region number. This new region has several very small spots. Location at midnight: S13W14.
December 10-12: No obviously geoeffective CMEs noted.
Coronal hole history (starting late October 2002)
Compare today's report with the situation one solar rotation ago: 30
days ago
29 days ago 25 days ago
A fairly small, decaying, recurrent coronal hole in the southern hemisphere was in a geoeffective position on December 10-11. A trans equatorial, recurrent extension of the southern polar coronal hole will rotate into a geoeffective position on December 15-16.
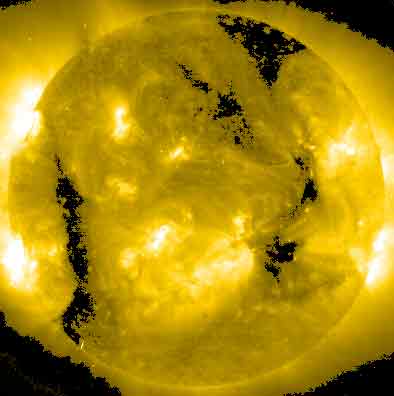
Processed SOHO EIT 284 image at 19:06 UTC on December 12. Any black areas on the solar disk are likely coronal holes.
The geomagnetic field is expected to be mostly quiet to unsettled on December 13-15. A weak coronal stream will likely begin on December 13 and could cause a few active intervals that day and on December 14. Long distance medium wave (AM) band propagation along east-west paths over high and upper middle latitudes is fair to good.
| Coronal holes (1) | Coronal mass ejections (2) | M and X class flares (3) |
1) Effects from a coronal hole could reach Earth within the
next 5 days.
2) Material from a CME is likely to impact Earth within 96 hours.
3) There is a possibility of either M or X class flares within the next 48
hours.
Green: 0-20% probability, Yellow: 20-60% probability, Red: 60-100% probability.
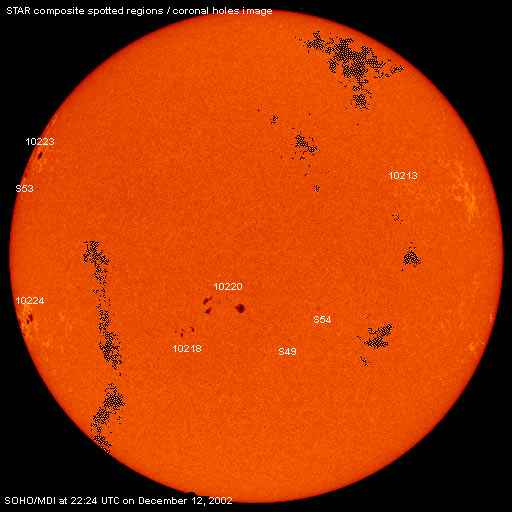
Composite image based on a SOHO/MDI continuum image and overlaid by a coronal hole image. Region numbering has been included.
Data for all numbered solar regions according to the Solar Region Summary provided by SEC/NOAA. Comments are my own, as is the STAR spot count (spots observed at or just prior to midnight) and data for regions not numbered by SEC or where SEC has observed no spots.
| Solar region | Date numbered | SEC spot count |
STAR spot count |
Location at midnight | Area | Classification | Comment |
|---|---|---|---|---|---|---|---|
| 10212 | 2002.12.02 | N13W59 | plage | ||||
| 10213 | 2002.12.03 | 4 | 3 | N17W41 | 0010 | CSO | |
| 10215 | 2002.12.05 | 1 | S17W21 | 0030 | HRX | now spotless | |
| 10217 | 2002.12.08 | 2 | N14E04 | 0000 | AXX | spotless all day | |
| 10218 | 2002.12.08 | 2 | 7 | S19E17 | 0020 | HSX |
beta-gamma classification was DAO at midnight with an area of 0070 |
| 10219 | 2002.12.09 | S05W64 | plage | ||||
| 10220 | 2002.12.09 | 17 | 16 | S12E07 | 0190 | DAI | |
| 10221 | 2002.12.09 | 2 | N23E22 | 0010 | BXO | spotless all day | |
| 10222 | 2002.12.11 | 7 | S06W16 | 0010 | BXO |
spotless all day see comment below on region S54 |
|
| 10223 | 2002.12.12 | 1 | 3 | N23E71 | 0070 | HSX |
classification was CSO at midnight |
| 10224 | 2002.12.12 | 3 | 12 | S16E70 | 0090 | DAO |
beta-gamma classification was EAO at midnight with an area of 0170 |
| S49 | emerged on 2002.12.09 |
4 | S22W09 | 0010 | BXO | ||
| S53 | visible on 2002.12.12 |
1 | N16E77 | 0040 | HSX | ||
| S54 | emerged on 2002.12.12 |
7 | S13W14 | 0010 | BXO |
SEC has this region as region 10222 |
|
| Total spot count: | 39 | 53 | |||||
| SSN: | 129 | 133 | |||||
| Month | Average solar flux at Earth |
International sunspot number | Smoothed sunspot number |
|---|---|---|---|
| 2000.04 | 184.2 | 125.5 | 120.8 cycle 23 sunspot max. |
| 2000.07 | 202.3 | 170.1 | 119.8 |
| 2001.11 | 210.6 | 106.5 | 115.5 (+1.5) |
| 2001.12 | 235.1 | 132.2 | 114.6 (-0.9) |
| 2002.01 | 226.6 | 114.1 | 113.5 (-1.1) |
| 2002.02 | 205.0 | 107.4 | 114.7 (+1.2) |
| 2002.03 | 179.5 | 98.4 | 113.4 (-1.3) |
| 2002.04 | 189.8 | 120.7 | 110.5 (-2.9) |
| 2002.05 | 178.4 | 120.8 | 108.8 (-1.7) |
| 2002.06 | 148.7 | 88.3 | (106.4 predicted, -2.4) |
| 2002.07 | 173.5 | 99.9 | (102.8 predicted, -3.6) |
| 2002.08 | 183.6 | 116.4 | (99.6 predicted, -3.2) |
| 2002.09 | 175.8 | 109.3 | (96.6 predicted, -3.0) |
| 2002.10 | 167.0 | 97.5 | (93.1 predicted, -3.5) |
| 2002.11 | 168.7 | 95.0 | (87.8 predicted, -5.3) |
| 2002.12 | 151.3 (1) | 54.3 (2) | (83.5 predicted, -4.3) |
1) Running average based on the daily 20:00 UT observed solar flux value at 2800
MHz.
2) Unofficial, accumulated value based on the Boulder (SEC/NOAA) sunspot number. The official
international sunspot number is typically 25-45% less.
This report has been prepared by Jan Alvestad. It is based partly on my own observations and interpretations, and partly on data from sources noted in solar links. Comments and suggestions are always welcome.
| [DX-Listeners' Club] [DX News] |