
Last update December 19, 2002 at 03:45 UTC.
[Solar and geomagnetic data
- last 4 weeks (updated daily)]
[Solar wind and electron
fluence charts (updated daily)]
[Solar cycles 21-23 (last
update December 2, 2002)]
[Solar cycles 1-20]
[Graphical comparison of
cycles 21, 22 and 23 (last update December 2, 2002)]
[Graphical comparison of
cycles 10, 13, 17, 20 and 23 (last update December 2, 2002)]
[Historical solar and geomagnetic
data charts 1954-2002 (last update October 13, 2002)]
[Archived reports (last update December 16, 2002)]
The geomagnetic field was quiet to unsettled on December 18. Solar wind speed ranged between 349 and 438 km/sec. The total field of the interplanetary magnetic field increased slowly all day, however, only a few and generally weak southward swings were observed causing the geomagnetic field to remain mostly quiet. The expected recurrent coronal stream arrived just after midnight on December 19 but does not yet appear to be as strong as it has been over the last few solar rotations.
Solar flare activity was moderate. Solar flux was 196.9, the planetary A
index was 6 (STAR Ap - based on the mean of three hour ap indices: 7.0).
Three hour interval K indices: 22012321 (planetary), 22102121 (Boulder).
The background x-ray flux is at the class B9-C1 level.
At midnight there were 9 spotted regions on the visible disk. A total of 11 C and 1 M class flares were recorded during the day. An optically uncorrelated C1.6 flare at 21:28 UTC may have had its source near region 10220 at the southwest limb.
Region 10218 decayed and had only a single small spot left at midnight. The region will likely become spotless today.
Region 10220 decayed slowly and quietly and will rotate over the southwest limb today.
Region 10223 remained mostly unchanged and quiet.
Region 10224 decayed fairly quickly losing nearly half of its spots and penumbral area. Flare: C1.6
at 05:45 UTC.
Region 10225 decayed further and appears to be losing all trailing spots.
Region 10226 developed further in the leading spot section which now has a huge penumbra. Some development was observed in
the southwestern part of the intermediate spot section where negative polarity flux has emerged close to the dominant positive
polarity area. While the region currently does not posses a magnetic delta, this new flux emergence could cause a delta to form. Further M class flaring is
likely and there is a chance of a major flare. Flares: C3.5 at 02:25, C6.9 at 02:33,
M2.4/1N at 06:42, C7.1 at 11:47, C1.8 at 14:41, C2.7 at 17:31, C1.4 at 19:37 and C2.0 at 22:12 UTC.
Region 10227 decayed further and lost all but one of its trailing spots. The positive and negative polarity areas are now
well separated and further decay is likely.
Region 10228 decayed becoming spotless by early morning.
Region 10229 decayed further losing a significant amount of penumbra in the leading and intermediate spot
sections. An M class flare is still possible. Flares: C2.3 at 03:01 and C1.9 at 20:28 UTC.
Region 10230 developed at a moderate pace with the leading penumbra tripling its areal coverage. A minor M class flare is
possible.
December 16-18: No obviously geoeffective CMEs noted.
Coronal hole history (starting late October 2002)
Compare today's report with the situation one solar rotation ago: 28
days ago
26 days ago 25 days ago
A trans equatorial, recurrent extension of the southern polar coronal hole was in a geoeffective position on December 15-16.

Processed SOHO EIT 284 image at 19:06 UTC on December 18. Any black areas on the solar disk are likely coronal holes.
The geomagnetic field is expected to be unsettled to minor storm on December 19 and unsettled to active on December 20-21 due to a coronal stream. Long distance medium wave (AM) band propagation along east-west paths over high and upper middle latitudes is fair to poor and degrading quickly.
| Coronal holes (1) | Coronal mass ejections (2) | M and X class flares (3) |
1) Effects from a coronal hole could reach Earth within the
next 5 days.
2) Material from a CME is likely to impact Earth within 96 hours.
3) There is a possibility of either M or X class flares within the next 48
hours.
Green: 0-20% probability, Yellow: 20-60% probability, Red: 60-100% probability.
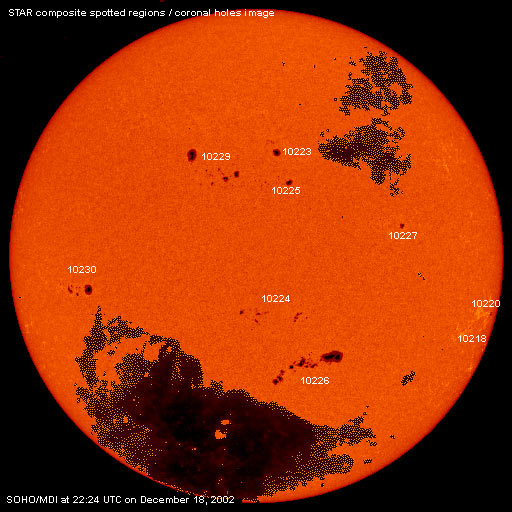
Composite image based on a SOHO/MDI continuum image and overlaid by a coronal hole image. Region numbering has been included. Compare to the previous day image.
Data for all numbered solar regions according to the Solar Region Summary provided by SEC/NOAA. Comments are my own, as is the STAR spot count (spots observed at or inside a few hours before midnight) and data for regions not numbered by SEC or where SEC has observed no spots.
| Solar region | Date numbered | SEC spot count |
STAR spot count |
Location at midnight | Area | Classification | Comment |
|---|---|---|---|---|---|---|---|
| 10217 | 2002.12.08 | N13W74 | plage | ||||
| 10218 | 2002.12.08 | 1 | 1 | S18W63 | 0020 | AXX |
area was 0000 at midnight |
| 10220 | 2002.12.09 | 1 | 1 | S13W78 | 0040 | HAX | |
| 10221 | 2002.12.09 | N20W53 | plage | ||||
| 10223 | 2002.12.12 | 7 | 5 | N25W06 | 0140 | CSO | |
| 10224 | 2002.12.12 | 33 | 21 | S14W08 | 0140 | EAO |
classification was FSO at midnight |
| 10225 | 2002.12.13 | 14 | 8 | N17W03 | 0090 | DAO |
classification was CAO at midnight |
| 10226 | 2002.12.13 | 47 | 41 | S28W15 | 0720 | FKI | beta-gamma |
| 10227 | 2002.12.13 | 7 | 4 | N07W34 | 0070 | CAO | |
| 10228 | 2002.12.14 | 4 | S17E10 | 0010 | BXO | now spotless | |
| 10229 | 2002.12.14 | 37 | 26 | N19E12 | 0440 | EKI |
beta-gamma area was near 0250 at midnight |
| 10230 | 2002.12.17 | 10 | 14 | S08E45 | 0150 | DAO |
classification was EAO at midnight, area 0230 |
| S57 | emerged on 2002.12.14 |
S21W67 | plage | ||||
| Total spot count: | 161 | 121 | |||||
| SSN: | 261 | 211 | |||||
| Month | Average solar flux at Earth |
International sunspot number | Smoothed sunspot number |
|---|---|---|---|
| 2000.04 | 184.2 | 125.5 | 120.8 cycle 23 sunspot max. |
| 2000.07 | 202.3 | 170.1 | 119.8 |
| 2001.11 | 210.6 | 106.5 | 115.5 (+1.5) |
| 2001.12 | 235.1 | 132.2 | 114.6 (-0.9) |
| 2002.01 | 226.6 | 114.1 | 113.5 (-1.1) |
| 2002.02 | 205.0 | 107.4 | 114.7 (+1.2) |
| 2002.03 | 179.5 | 98.4 | 113.4 (-1.3) |
| 2002.04 | 189.8 | 120.7 | 110.5 (-2.9) |
| 2002.05 | 178.4 | 120.8 | 108.8 (-1.7) |
| 2002.06 | 148.7 | 88.3 | (106.4 predicted, -2.4) |
| 2002.07 | 173.5 | 99.9 | (102.8 predicted, -3.6) |
| 2002.08 | 183.6 | 116.4 | (99.6 predicted, -3.2) |
| 2002.09 | 175.8 | 109.3 | (96.6 predicted, -3.0) |
| 2002.10 | 167.0 | 97.5 | (93.1 predicted, -3.5) |
| 2002.11 | 168.7 | 95.0 | (87.8 predicted, -5.3) |
| 2002.12 | 165.8 (1) | 96.7 (2) | (83.5 predicted, -4.3) |
1) Running average based on the daily 20:00 UT observed solar flux value at 2800
MHz.
2) Unofficial, accumulated value based on the Boulder (SEC/NOAA) sunspot number. The official
international sunspot number is typically 25-45% less.
This report has been prepared by Jan Alvestad. It is based partly on my own observations and interpretations, and partly on data from sources noted in solar links. Comments and suggestions are always welcome.
| [DX-Listeners' Club] [DX News] |