
Last update December 28, 2002 at 04:10 UTC.
[Solar and geomagnetic data
- last 4 weeks (updated daily)]
[Solar wind and electron
fluence charts (updated daily)]
[Solar cycles 21-23 (last
update December 2, 2002)]
[Solar cycles 1-20]
[Graphical comparison of
cycles 21, 22 and 23 (last update December 2, 2002)]
[Graphical comparison of
cycles 10, 13, 17, 20 and 23 (last update December 2, 2002)]
[Historical solar and geomagnetic
data charts 1954-2002 (last update October 13, 2002)]
[Archived reports (last update December 23, 2002)]
The geomagnetic field was unsettled to major storm on December 27. Solar wind speed ranged between 508 and 773 km/sec under the influence of a strong coronal stream.
Solar flare activity was very low. Solar flux was 116.5 (this is the lowest measured solar flux since July 30, 2001. Taking
into account Earth's distance to Sun and adjusting the values to 1 AU, this is the lowest solar flux level since September 1999), the planetary A
index was 37 (STAR Ap - based on the mean of three hour ap indices: 38.8).
Three hour interval K indices: 46455443 (planetary), 35454333 (Boulder).
The background x-ray flux is at the class B2-B3 level.
At midnight there were 4 spotted regions on the visible disk, 1 of which has not yet been numbered. No flaring of interest was observed all day.
Region 10230 decayed slowly and will rotate over the southwest limb today.
Region 10234 was quiet and stable.
New region 10236 emerged fairly quickly in the northwest quadrant at the northern edge of the large trans equatorial
coronal hole. C class flaring are possible.
Spotted regions not yet numbered by SEC:
[S61] A new region emerged south of region 10234. Location at midnight: N08E28.
December 25-27: No obviously geoeffective CMEs observed.
Coronal hole history (since late October 2002)
Compare today's report with the situation one solar rotation ago: 28
days ago
27 days ago 26 days ago
A large and well defined trans equatorial extension of the southern polar coronal hole was in a geoeffective position on December 24-25.
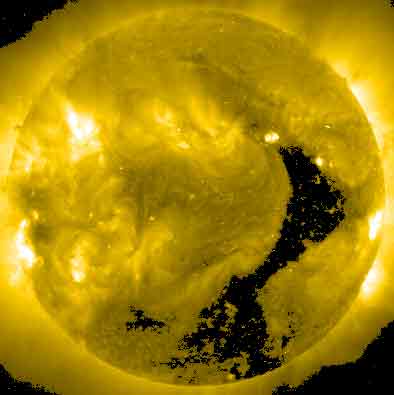
Processed SOHO EIT 284 image at 19:06 UTC on December 27. Any black areas on the solar disk are likely coronal holes.
The geomagnetic field is expected to be unsettled to active on December 28 and quiet to active on December 29 due to a coronal stream. Long distance medium wave (AM) band propagation along east-west paths over high and upper middle latitudes is very poor.
| Coronal holes (1) | Coronal mass ejections (2) | M and X class flares (3) |
1) Effects from a coronal hole could reach Earth within the
next 5 days.
2) Material from a CME is likely to impact Earth within 96 hours.
3) There is a possibility of either M or X class flares within the next 48
hours.
Green: 0-20% probability, Yellow: 20-60% probability, Red: 60-100% probability.
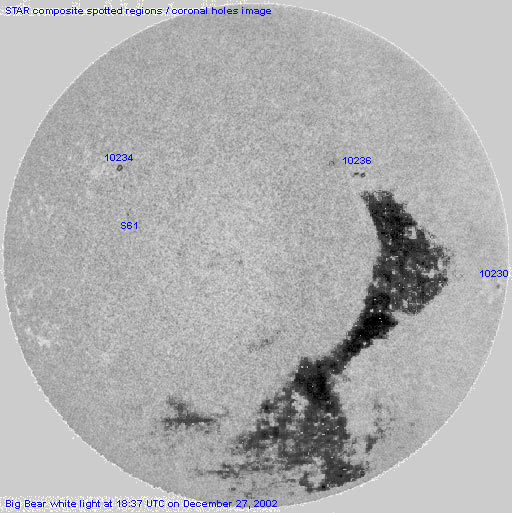
Composite image based on a [Temporarily replaced: SOHO/MDI continuum image] processed BBSO white light image and overlaid by a coronal hole image. Region numbering has been included. Compare to the previous day's image.
Data for all numbered solar regions according to the Solar Region Summary provided by SEC/NOAA. Comments are my own, as is the STAR spot count (spots observed at or inside a few hours before midnight) and data for regions not numbered by SEC or where SEC has observed no spots.
| Solar region | Date numbered | SEC spot count |
STAR spot count |
Location at midnight | Area | Classification | Comment |
|---|---|---|---|---|---|---|---|
| 10230 | 2002.12.17 | 2 | 1 | S08W77 | 0060 | HSX | |
| 10231 | 2002.12.19 | 4 | S25W89 | 0050 | CSO | rotated out of view | |
| 10232 | 2002.12.21 | N13W86 | plage | ||||
| 10233 | 2002.12.23 | N13W12 | plage | ||||
| 10234 | 2002.12.24 | 1 | 4 | N18E32 | 0050 | HSX |
classification was CAO at midnight |
| 10235 | 2002.12.25 | 2 | N13E05 | 0010 | BXO | actually spotless | |
| 10236 | 2002.12.27 | 4 | 7 | N17W27 | 0030 | CAO |
classification was DSO at midnight |
| S61 | emerged on 2002.12.27 |
1 | N08E28 | 0010 | AXX | ||
| Total spot count: | 13 | 13 | |||||
| SSN: | 63 | 53 | |||||
| Month | Average solar flux at Earth |
International sunspot number | Smoothed sunspot number |
|---|---|---|---|
| 2000.04 | 184.2 | 125.5 | 120.8 cycle 23 sunspot max. |
| 2000.07 | 202.3 | 170.1 | 119.8 |
| 2001.11 | 210.6 | 106.5 | 115.5 (+1.5) |
| 2001.12 | 235.1 | 132.2 | 114.6 (-0.9) |
| 2002.01 | 226.6 | 114.1 | 113.5 (-1.1) |
| 2002.02 | 205.0 | 107.4 | 114.7 (+1.2) |
| 2002.03 | 179.5 | 98.4 | 113.4 (-1.3) |
| 2002.04 | 189.8 | 120.7 | 110.5 (-2.9) |
| 2002.05 | 178.4 | 120.8 | 108.8 (-1.7) |
| 2002.06 | 148.7 | 88.3 | (106.4 predicted, -2.4) |
| 2002.07 | 173.5 | 99.9 | (102.8 predicted, -3.6) |
| 2002.08 | 183.6 | 116.4 | (99.6 predicted, -3.2) |
| 2002.09 | 175.8 | 109.3 | (96.6 predicted, -3.0) |
| 2002.10 | 167.0 | 97.5 | (93.1 predicted, -3.5) |
| 2002.11 | 168.7 | 95.0 | (87.8 predicted, -5.3) |
| 2002.12 | 163.4 (1) | 137.8 (2) | (83.5 predicted, -4.3) |
1) Running average based on the daily 20:00 UT observed solar flux value at 2800
MHz.
2) Unofficial, accumulated value based on the Boulder (SEC/NOAA) sunspot number. The official
international sunspot number is typically 25-45% less.
This report has been prepared by Jan Alvestad. It is based partly on my own observations and interpretations, and partly on data from sources noted in solar links. Comments and suggestions are always welcome.
| [DX-Listeners' Club] [DX News] |