
Last update issued on July 21, 2003 at 03:50 UTC.
[Solar and geomagnetic data - last month (updated daily)]
[Solar wind and electron fluence charts (updated daily)]
[Solar cycles 21-23 (last update July 2, 2003)]
[Solar cycles 1-20]
[Graphical comparison of cycles 21, 22 and 23 (last update July 2, 2003)]
[Graphical comparison of cycles 2, 10, 13, 17, 20 and 23 (last update July 2, 2003)]
[Historical solar and geomagnetic data charts 1954-2003 (last update April 13, 2003)]
[Archived reports (last update July 21, 2003)]
The geomagnetic field was unsettled to minor storm on July 20. Solar wind speed ranged between 562 and 867.
Solar flux measured at 20h UTC on 2.8 GHz was 157.3. The planetary A
index was 19 (STAR Ap - based on the mean of three hour interval ap indices: 20.0).
Three hour interval K indices: 54433333 (planetary), 54433323 (Boulder).
The background x-ray flux is at the class B8 level.
At midnight there were 11 spotted regions on the visible disk. Solar flare activity was low. A total of 23 C class events was recorded during the day.
Region 10405 decayed and could soon become spotless..
Region 10409 decayed slowly and quietly.
Region 10410 developed further and became even more compact. Most of the spots are inside a single extremely large
penumbra. There is a magnetic delta structure in the southeastern part of the region. A major flare is possible anytime over the
next few days. Flares: C1.8 at 00:30, C2.8 at 01:15, C1.4 at 03:16, C3.9 at 03:56, C1.1 at 04:39, C1.2 at 05:23, C1.4 at
06:25, C2.5 at 08:23, C2.4 at 10:02, C1.7 at 11:55, C2.1 at 12:06, C3.7 at 14:52, C1.8 at 15:54, C5.6 at 16:08, C3.7 at 16:47, C3.9 at 17:26, C3.6 at 17:58,
C3.1 at 18:11, C4.4 at 19:11, C2.7 at 21:08 and C1.6 at 23:41 UTC.
Region 10411 was quiet and stable.
Region 10412 decayed but could still produce a minor M class flare.
Region 10413 was quiet and stable but could become spotless today or tomorrow.
Region 10414 was generally unchanged and quiet.
Region 10415 decayed in the leading spot section while some new spots emerged scattered throughout the region.
New region 10416 emerged in the southwest quadrant on July 19 and developed slowly on July 20.
New region 10417 emerged in the southwest quadrant to the southwest of region 10410 on July 19 and developed very quickly
on July 20. There may be a magnetic delta structure in the trailing spot section and possibly even in the most northern penumbra. Flare:
C2.0 at 08:36 UTC.
New region 10418 emerged on July 18 in the southeast quadrant and was noticed by SEC two days later. The region developed
slowly on July 20.
July 19: A faint partial halo CME was observed in LASCO C3 images early in the day following an event in region 10412. The CME was observed over the west limbs and some of the east limbs.
July 18 and 20: No potentially geoeffective CMEs observed.
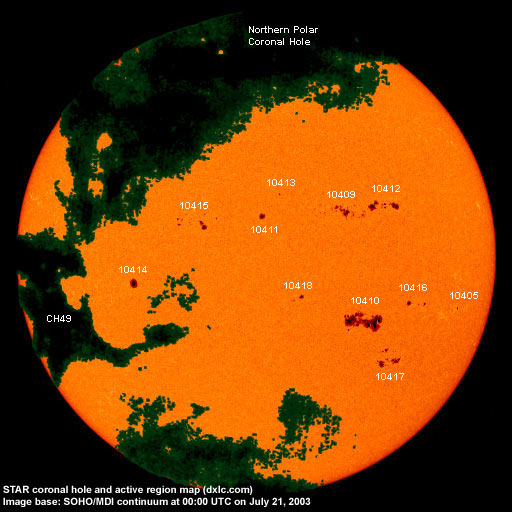
Coronal hole history (since late October 2002)
Compare today's report with the situation one solar rotation ago: 28
days ago 27 days ago 26 days ago
A large coronal hole (CH49) in the southern hemisphere will likely be in a geoeffective position on July 24-27, a thin western extension could be in a geoeffective position on July 22.
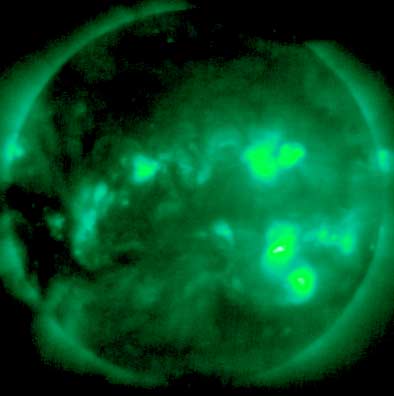
Processed GOES SXI coronal structure image at 23:54 UTC on July 20. The darkest areas on the solar disk are likely coronal holes.
The geomagnetic field is expected to be quiet to active on July 21-23.
Long distance medium wave (AM) band propagation along east-west paths over high and upper middle latitudes is very poor. Propagation along north-south paths is poor. [Trans Atlantic propagation conditions are currently monitored every night on 1470 kHz. Dominant station tonight: Radio Cristal del Uruguay (noted early on, the listening session then had to be aborted because of an approaching thunderstorm)]
| Coronal holes (1) | Coronal mass ejections (2) | M and X class flares (3) |
1) Effects from a coronal hole could reach Earth within the next 5 days.
2) Material from a CME is likely to impact Earth within 96 hours.
3) There is a possibility of either M or X class flares within the next 48 hours.
Green: 0-20% probability, Yellow: 20-60% probability, Red: 60-100% probability.
Compare to the previous day's image.
Data for all numbered solar regions according to the Solar Region Summary provided by NOAA/SEC. Comments are my own, as is the STAR spot count (spots observed at or inside a few hours before midnight) and data for regions not numbered by SEC or where SEC has observed no spots.
| Solar region | Date numbered | SEC spot count |
STAR spot count |
Location at midnight | Area | Classification | Comment |
|---|---|---|---|---|---|---|---|
| 10405 | 2003.07.11 | 1 | 1 | S11W57 | 0020 | HSX | |
| 10407 | 2003.07.11 | N10W88 | plage | ||||
| 10408 | 2003.07.13 | N13W71 | plage | ||||
| 10409 | 2003.07.13 | 15 | 20 | N15W22 | 0160 | DAO | |
| 10410 | 2003.07.13 | 44 | 55 | S12W26 | 0620 | EAC |
beta-gamma-delta
classification was EKC at midnight, area 1150 |
| 10411 | 2003.07.15 | 1 | 1 | N17W03 | 0030 | HSX |
area was 0070 at midnight location was N14W03 SEC has the same data for both region 10411 and 10413 |
| 10412 | 2003.07.16 | 14 | 17 | N16W34 | 0200 | DSI |
beta-gamma
classification was DAI at midnight, area 0260 |
| 10413 | 2003.07.16 | 1 | 1 | N17W03 | 0040 | HSX |
classification was HRX at midnight, area 0010 location was N20W06 see comment for region 10411 |
| 10414 | 2003.07.17 | 1 | 1 | S02E32 | 0130 | HSX | |
| 10415 | 2003.07.19 | 9 | 16 | N13E16 | 0110 | DSO | |
| 10416 | 2003.07.20 | 4 | 6 | S09W42 | 0030 | DSO |
formerly region S212 area was 0060 at midnight |
| 10417 | 2003.07.20 | 21 | 30 | S22W36 | 0110 | DSO |
beta-gamma-delta? formerly region S213 classification was DAI at midnight, area 0220 |
| 10418 | 2003.07.20 | 3 | 5 | S05W08 | 0020 | CSO |
formerly region S211 classification was CAO at midnight, area 0040 |
| S208 | emerged on 2003.07.15 |
N11W81 | plage | ||||
| Total spot count: | 114 | 153 | |||||
| SSN: | 224 | 263 | |||||
| Month | Average solar flux at Earth |
International sunspot number | Smoothed sunspot number |
|---|---|---|---|
| 2000.04 | 184.2 | 125.5 | 120.8 cycle 23 sunspot max. |
| 2000.07 | 202.3 | 170.1 | 119.8 |
| 2001.12 | 235.1 | 132.2 | 114.6 (-0.9) |
| 2002.06 | 148.7 | 88.3 | 106.2 (-2.6) |
| 2002.07 | 173.5 | 99.6 | 102.7 (-3.5) |
| 2002.08 | 183.6 | 116.4 | 98.7 (-4.0) |
| 2002.09 | 175.8 | 109.6 | 94.6 (-4.1) |
| 2002.10 | 167.0 | 97.5 | 90.5 (-4.1) |
| 2002.11 | 168.7 | 95.5 | 85.2 (-5.3) |
| 2002.12 | 157.2 | 80.8 | 82.0 (-3.2) |
| 2003.01 | 144.0 | 79.7 | (79.7 predicted, -2.3) |
| 2003.02 | 124.5 | 46.0 | (74.7 predicted, -5.0) |
| 2003.03 | 131.4 | 61.1 | (69.0 predicted, -5.7) |
| 2003.04 | 126.4 | 60.0 | (64.1 predicted, -4.9) |
| 2003.05 | 115.7 | 55.2 | (59.2 predicted, -4.9) |
| 2003.06 | 129.3 | 77.4 | (55.2 predicted, -4.0) |
| 2003.07 | 133.0 (1) | 95.1 (2) | (51.6 predicted, -3.6) |
1) Running average based on the daily 20:00 UTC observed solar flux value at 2800 MHz.
2) Unofficial, accumulated value based on the Boulder (NOAA/SEC) sunspot number. The official international sunspot number is typically
30-50% less.
This report has been prepared by Jan Alvestad. It is based partly on my own observations and interpretations, and partly on data from sources noted in solar links. All time references are to the UTC day. Comments and suggestions are always welcome.
| [DX-Listeners' Club] |