
Last update issued on June 25, 2003 at 02:55 UTC.
[Solar and geomagnetic data - last month (updated daily)]
[Solar wind and electron fluence charts (updated daily)]
[Solar cycles 21-23 (last update June 3, 2003)]
[Solar cycles 1-20]
[Graphical comparison of cycles 21, 22 and 23 (last update June 3, 2003)]
[Graphical comparison of cycles 2, 10, 13, 17, 20 and 23 (last update June 3, 2003)]
[Historical solar and geomagnetic data charts 1954-2003 (last update April 13, 2003)]
[Archived reports (last update June 23, 2003)]
The geomagnetic field was unsettled to minor storm on June 24. Solar wind speed ranged between 467 and 580 km/sec under the influence of a high speed stream.
Solar flux measured at 20h UTC on 2.8 GHz was 114.5. The planetary A
index was 31 (STAR Ap - based on the mean of three hour interval ap indices: 32.8).
Three hour interval K indices: 45555333 (planetary), 45554323 (Boulder).
The background x-ray flux is at the class B3 level.
At midnight there were 6 spotted regions on the visible disk. Solar flare activity was low. A total of 4 C class events was recorded during the day.
Region 10386 decayed further and lost its magnetic delta structure.
Region 10387
decayed, particularly in the trailing spot section and was quiet.
Region 10390 decayed slowly and quietly.
Region 10391 developed further and was the only flare producing region. Flares: C1.5
at 04:57, C1.3 at 09:36, C2.8 at 10:24 and C1.4 at 13:29 UTC.
New region 10392 rotated into view at the northeast limb.
New region 10393 rotated into view at the southeast limb.
June 22-23: No obviously geoeffective CMEs observed.
June 24: No LASCO images available as there are problems with the SOHO high gain antenna (see this story
at the SOHO site).
Coronal hole history (since late October 2002)
Compare today's report with the situation one solar rotation ago: 28
days ago 27 days ago 26 days ago
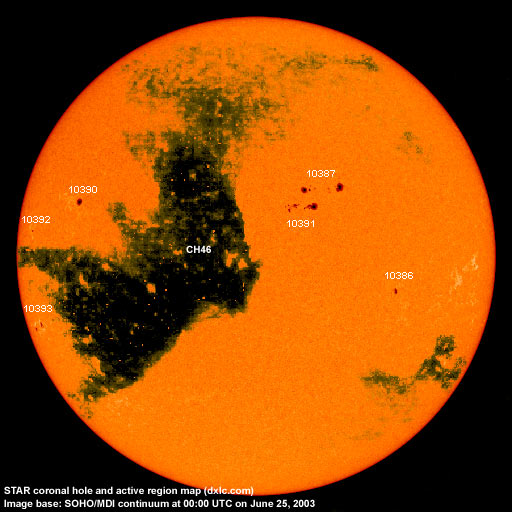
A huge, recurrent coronal hole (CH46) mainly in the southern hemisphere and with a large leading trans equatorial extension will rotate into a geoeffective position from late on June 24 until July 2. The trans equatorial extension has become much larger over the last solar rotation.

Processed SOHO EIT 284 image at 21:56 UTC on June 24. Any black areas on the solar disk are likely coronal holes.
The geomagnetic field is expected to be quiet to unsettled on June 25-26 and early on June 27. Then a high speed stream from coronal hole CH46 will cause unsettled to major storm conditions until July 1 becoming unsettled to active on July 2-4.
Long distance medium wave (AM) band propagation along east-west paths over high and upper middle latitudes is very poor to poor. Propagation along north-south paths is poor to fair. [Trans Atlantic propagation conditions are currently monitored every night on 1470 kHz. Dominant station tonight: none early on, at local sunrise Cadena Peruana de Noticias was the best station. Otherwise reception conditions were generally better westwards than they have been for several weeks, usually dominant Harbour Light on 1400 kHz and WHDP on 1620 kHz were again audible.]
| Coronal holes (1) | Coronal mass ejections (2) | M and X class flares (3) |
1) Effects from a coronal hole could reach Earth within the next 5 days.
2) Material from a CME is likely to impact Earth within 96 hours.
3) There is a possibility of either M or X class flares within the next 48 hours.
Green: 0-20% probability, Yellow: 20-60% probability, Red: 60-100% probability.
Compare to the previous day's image.
Data for all numbered solar regions according to the Solar Region Summary provided by NOAA/SEC. Comments are my own, as is the STAR spot count (spots observed at or inside a few hours before midnight) and data for regions not numbered by SEC or where SEC has observed no spots.
| Solar region | Date numbered | SEC spot count |
STAR spot count |
Location at midnight | Area | Classification | Comment |
|---|---|---|---|---|---|---|---|
| 10385 | 2003.06.15 | N28W88 | plage | ||||
| 10386 | 2003.06.16 | 9 | 4 | S06W35 | 0060 | CAO |
classification was HAX at midnight |
| 10387 | 2003.06.18 | 16 | 15 | N19W16 | 0160 | EAO | |
| 10388 | 2003.06.19 | 8 | S02W57 | 0060 | DAO | spotless at midnight | |
| 10389 | 2003.06.20 | S12W38 | plage | ||||
| 10390 | 2003.06.22 | 7 | 2 | N13E51 | 0090 | CAO |
classification was HSX at midnight |
| 10391 | 2003.06.23 | 17 | 18 | N14W09 | 0110 | DAO | |
| 10392 | 2003.06.24 | 2 | 1 | N07E69 | 0030 | HAX |
classification was HSX at midnight |
| 10393 | 2003.06.24 | 2 | 5 | S15E72 | 0060 | DAO | |
| S187 | emerged on 2003.06.17 |
S22W78 | plage | ||||
| S192 | emerged on 2003.06.23 |
N05W05 | plage | ||||
| Total spot count: | 61 | 45 | |||||
| SSN: | 131 | 105 | |||||
| Month | Average solar flux at Earth |
International sunspot number | Smoothed sunspot number |
|---|---|---|---|
| 2000.04 | 184.2 | 125.5 | 120.8 cycle 23 sunspot max. |
| 2000.07 | 202.3 | 170.1 | 119.8 |
| 2001.12 | 235.1 | 132.2 | 114.6 (-0.9) |
| 2002.05 | 178.4 | 120.8 | 108.8 (-1.7) |
| 2002.06 | 148.7 | 88.3 | 106.2 (-2.6) |
| 2002.07 | 173.5 | 99.6 | 102.7 (-3.5) |
| 2002.08 | 183.6 | 116.4 | 98.7 (-4.0) |
| 2002.09 | 175.8 | 109.6 | 94.6 (-4.1) |
| 2002.10 | 167.0 | 97.5 | 90.5 (-4.1) |
| 2002.11 | 168.7 | 95.5 | 85.2 (-5.3) |
| 2002.12 | 157.2 | 80.8 | (81.4 predicted, -3.8) |
| 2003.01 | 144.0 | 79.5 | (78.3 predicted, -3.1) |
| 2003.02 | 124.5 | 46.2 | (73.3 predicted, -5.0) |
| 2003.03 | 131.4 | 61.5 | (67.6 predicted, -5.7) |
| 2003.04 | 126.4 | 60.0 | (62.7 predicted, -4.9) |
| 2003.05 | 115.7 | 55.2 | (57.8 predicted, -4.9) |
| 2003.06 | 130.9 (1) | 92.2 (2) | (53.8 predicted, -4.0) |
1) Running average based on the daily 20:00 UTC observed solar flux value at 2800 MHz.
2) Unofficial, accumulated value based on the Boulder (NOAA/SEC) sunspot number. The official international sunspot number is typically
30-50% less.
This report has been prepared by Jan Alvestad. It is based partly on my own observations and interpretations, and partly on data from sources noted in solar links. All time references are to the UTC day. Comments and suggestions are always welcome.
| [DX-Listeners' Club] |