
Last update issued on June 7, 2003 at 04:30 UTC.
[Solar and geomagnetic data - last month (updated daily)]
[Solar wind and electron fluence charts (updated daily)]
[Solar cycles 21-23 (last update June 3, 2003)]
[Solar cycles 1-20]
[Graphical comparison of cycles 21, 22 and 23 (last update June 3, 2003)]
[Graphical comparison of cycles 2, 10, 13, 17, 20 and 23 (last update June 3, 2003)]
[Historical solar and geomagnetic data charts 1954-2003 (last update April 13, 2003)]
[Archived reports (last update June 1, 2003)]
The geomagnetic field was quiet to unsettled on June 6. Solar wind speed ranged between 482 and 703 km/sec under the influence of a high speed stream from the eastern part of coronal hole CH42.
Solar flux measured at 20h UTC on 2.8 GHz was 125.6. The planetary A
index was 13 (STAR Ap - based on the mean of three hour interval ap indices: 14.1).
Three hour interval K indices: 32333333 (planetary), 22332333 (Boulder).
The background x-ray flux is at the class B7 level.
At midnight there were 9 spotted regions on the visible disk. Solar flare activity was moderate. A total of 10 C and 1 M class events was recorded during the day.
Region 10373 was quiet and stable.
Region 10375 developed quickly, particularly in the southern part where impressive penumbral growth was observed.
Several small negative polarity spots are located some distance to the east of the majority of the spots, however, magnetograms
that these spots do belong to this region. The region has a magnetic delta structure and could produce further M class flares. A
major flare is possible as well. Flares: C1.1 at 04:05, C1.4 at 11:50, C2.8/1F at 13:58, C2.5
at 16:18 and M1.0 at 23:38 UTC. The M flare was associated with a weak type II radio sweep and a small CME observed off of the
north pole.
Region 10376 decayed quickly and had a couple of tiny spots left at the end of the day.
Region 10377 developed slowly and quietly.
Region 10378 developed slowly adding a trailing penumbra. Flare: C2.5 at 17:44 UTC.
New region 10379 emerged on June 5 and was numbered by SEC the next day. The region is decaying and could become spotless
before rotating over the southwest limb on June 8.
Spotted regions not yet numbered by NOAA/SEC:
[S176] A new region emerged on June 5 west of region 10375. The region developed slowly on June 6 as penumbra formed on the
leading spot. Location at midnight: N14E01.
[S178] A new region emerged in the southwest quadrant on June 6. Location at midnight: S15W28.
[S179] A new region rotated partly into view at the southeast limb on June 6. This is a large region and appears to be
fairly complex. A large positive polarity field has negative polarity areas both on its eastern and western sides. Minor M class
flaring is likely from this region with major flares possible. Location at midnight: S15E80. The region was the source of a long
duration C9 event early on June 7. Flares: C1.6 at 12:23, C1.5 at 12:52, C1.5 at 13:20, C2.3
at 14:35 and C1.6 at 15:42 UTC.
June 4-6: No obviously geoeffective CMEs observed. A full halo CME observed on June 6 apparently had its origin several days behind the southwest limb.
Coronal hole history (since late October 2002)
Compare today's report with the situation one solar rotation ago: 28
days ago 27 days ago 26
days ago
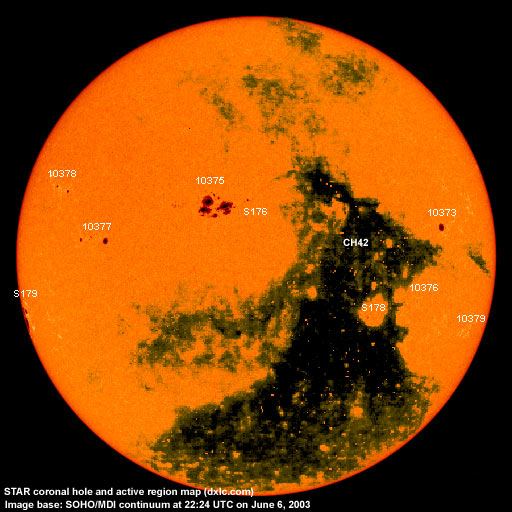
A huge recurrent coronal hole (CH42) in the southern hemisphere was in a geoeffective position on May 29-June 6.

Processed SOHO EIT 284 image at 01:06 UTC on June 7. Any black areas on the solar disk are likely coronal holes.
The geomagnetic field is expected to be unsettled to minor storm June 7-9 due to a high speed stream from the eastern part of coronal hole CH42.
Long distance medium wave (AM) band propagation along east-west paths over high and upper middle latitudes is very poor and will likely stay poor to very poor until at least June 10. Propagation along north-south paths is fair to good. [Trans Atlantic propagation conditions are currently monitored every night on 1470 kHz. Dominant station tonight: Radio Cristal del Uruguay]
| Coronal holes (1) | Coronal mass ejections (2) | M and X class flares (3) |
1) Effects from a coronal hole could reach Earth within the next 5 days.
2) Material from a CME is likely to impact Earth within 96 hours.
3) There is a possibility of either M or X class flares within the next 48 hours.
Green: 0-20% probability, Yellow: 20-60% probability, Red: 60-100% probability.
Compare to the previous day's image.
Data for all numbered solar regions according to the Solar Region Summary provided by NOAA/SEC. Comments are my own, as is the STAR spot count (spots observed at or inside a few hours before midnight) and data for regions not numbered by SEC or where SEC has observed no spots.
| Solar region | Date numbered | SEC spot count |
STAR spot count |
Location at midnight | Area | Classification | Comment |
|---|---|---|---|---|---|---|---|
| 10373 | 2003.05.27 | 2 | 1 | N07W52 | 0080 | CSO |
classification was HSX at midnight |
| 10375 | 2003.06.01 | 25 | 80 | N12E09 | 0490 | DKI |
beta-gamma-delta classification was FKI at midnight, area 0700 |
| 10376 | 2003.06.02 | 1 | 2 | S11W44 | 0020 | HSX |
classification was AXX at midnight, area 0000 |
| 10377 | 2003.06.04 | 5 | 11 | N04E43 | 0090 | DSO | |
| 10378 | 2003.06.05 | 2 | 4 | N16E57 | 0040 | CRO |
classification was DSO at midnight |
| 10379 | 2003.06.06 | 3 | 1 | S19W68 | 0040 | CSO |
formerly region S177 classification was AXX at midnight, area 0010 |
| S173 | emerged on 2003.05.28 |
N05W73 | plage | ||||
| S175 | emerged on 2003.05.31 |
N14W63 | plage | ||||
| S176 | emerged on 2003.06.05 |
3 | N14E01 | 0020 | HSX | ||
| S178 | emerged on 2003.06.06 |
6 | S15W28 | 0020 | BXO | ||
| S179 | visible on 2003.06.06 |
12 | S15E80 | 0500 | DKC | beta-gamma-delta | |
| Total spot count: | 38 | 120 | |||||
| SSN: | 98 | 210 | |||||
| Month | Average solar flux at Earth |
International sunspot number | Smoothed sunspot number |
|---|---|---|---|
| 2000.04 | 184.2 | 125.5 | 120.8 cycle 23 sunspot max. |
| 2000.07 | 202.3 | 170.1 | 119.8 |
| 2001.12 | 235.1 | 132.2 | 114.6 (-0.9) |
| 2002.05 | 178.4 | 120.8 | 108.8 (-1.7) |
| 2002.06 | 148.7 | 88.3 | 106.2 (-2.6) |
| 2002.07 | 173.5 | 99.6 | 102.7 (-3.5) |
| 2002.08 | 183.6 | 116.4 | 98.7 (-4.0) |
| 2002.09 | 175.8 | 109.6 | 94.6 (-4.1) |
| 2002.10 | 167.0 | 97.5 | 90.5 (-4.1) |
| 2002.11 | 168.7 | 95.5 | 85.2 (-5.3) |
| 2002.12 | 157.2 | 80.8 | (81.4 predicted, -3.8) |
| 2003.01 | 144.0 | 79.5 | (78.3 predicted, -3.1) |
| 2003.02 | 124.5 | 46.2 | (73.3 predicted, -5.0) |
| 2003.03 | 131.4 | 61.5 | (67.6 predicted, -5.7) |
| 2003.04 | 126.4 | 60.0 | (62.7 predicted, -4.9) |
| 2003.05 | 115.7 | 55.2 | (57.8 predicted, -4.9) |
| 2003.06 | 115.5 (1) | 14.9 (2) | (53.8 predicted, -4.0) |
1) Running average based on the daily 20:00 UTC observed solar flux value at 2800 MHz.
2) Unofficial, accumulated value based on the Boulder (NOAA/SEC) sunspot number. The official international sunspot number is typically
30-50% less.
This report has been prepared by Jan Alvestad. It is based partly on my own observations and interpretations, and partly on data from sources noted in solar links. All time references are to the UTC day. Comments and suggestions are always welcome.
| [DX-Listeners' Club] |