
Last update issued on June 27, 2003 at 03:50 UTC.
[Solar and geomagnetic data - last month (updated daily)]
[Solar wind and electron fluence charts (updated daily)]
[Solar cycles 21-23 (last update June 3, 2003)]
[Solar cycles 1-20]
[Graphical comparison of cycles 21, 22 and 23 (last update June 3, 2003)]
[Graphical comparison of cycles 2, 10, 13, 17, 20 and 23 (last update June 3, 2003)]
[Historical solar and geomagnetic data charts 1954-2003 (last update April 13, 2003)]
[Archived reports (last update June 23, 2003)]
The geomagnetic field was unsettled to active on June 26. Solar wind speed ranged between 477 and 686 km/sec. A high speed stream, likely from coronal hole CH46, arrived at ACE just before noon with solar wind speed increasing to near 700 km/sec.
Solar flux measured at 20h UTC on 2.8 GHz was 118.9. The planetary A
index was 19 (STAR Ap - based on the mean of three hour interval ap indices: 20.9).
Three hour interval K indices: 43444333 (planetary), 33334333 (Boulder).
The background x-ray flux is at the class B3 level.
At midnight there were 9 spotted regions on the visible disk. Solar flare activity was low. A total of 3 C class events was recorded during the day.
Region 10387
decayed further losing penumbral area and several spots.
Region 10390 was quiet and stable.
Region 10391 decayed significantly with the trailing spots losing most of their penumbra.
Region 10392 was quiet and stable.
Region 10393 lost the trailing penumbra, new trailing spots emerged further north.
New region 10394 emerged to the south of region 10390.
New region 10395 rotated into view at the northeast limb early on June 25 and was numbered by SEC the next day.
Spotted regions not numbered by NOAA/SEC:
[S194] A new region emerged quickly in the southeast quadrant near the central meridian on June 26. Location at midnight:
S04E01.
[S195] Old region 10375 rotated partly into view at the northeast limb late on June 26 displaying a large leading penumbra.
The region has M class flare potential. Location at midnight: N09E85. Flares: Long duration
events peaked at C1.4 at 11:30, at C1.7 at 13:16 and at C2.4 at 19:19 UTC.
June 24-26: No LASCO images available. There is a serious problem with the SOHO high gain antenna.
Coronal hole history (since late October 2002)
Compare today's report with the situation one solar rotation ago: 28
days ago 27 days ago 26 days ago
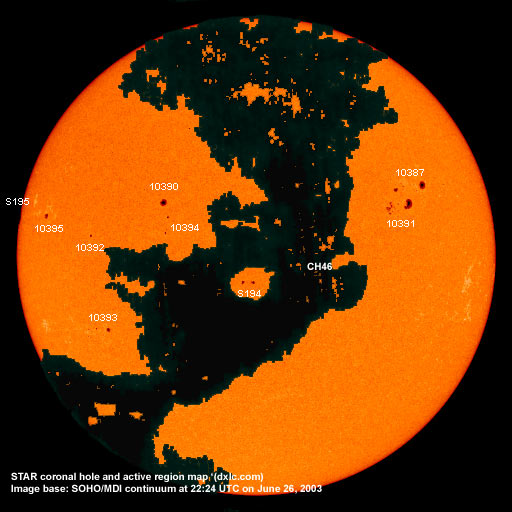
A huge, recurrent coronal hole (CH46) mainly in the southern hemisphere and with a large leading trans equatorial extension will rotate into a geoeffective position from late on June 24 until June 30. The trans equatorial extension has become much larger over the last solar rotation.
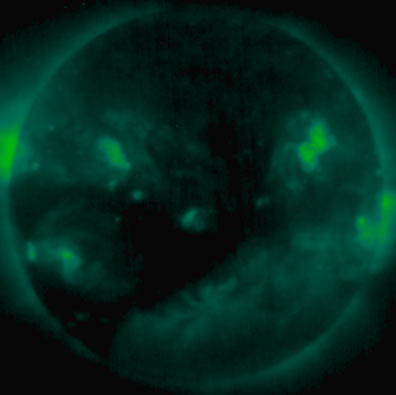
Processed GOES SXI coronal structure image at 22:28 UTC on June 26. The darkest areas on the solar disk are likely coronal holes.
The geomagnetic field is expected to be unsettled to major storm until July 1, unsettled to active is likely on July 2-4.
Long distance medium wave (AM) band propagation along east-west paths over high and upper middle latitudes is poor to fair. Propagation along north-south paths is fair. [Trans Atlantic propagation conditions are currently monitored every night on 1470 kHz. Dominant station tonight: Radio Cristal del Uruguay. Several other stations were noted, including at least 2 from Brazil. Overall propagation conditions were unusual with 1510 WWZN Boston heard well at local sunrise along with a few other east coast US stations. At the same time a strong signal from Brazil was observed on 930 kHz.]
| Coronal holes (1) | Coronal mass ejections (2) | M and X class flares (3) |
1) Effects from a coronal hole could reach Earth within the next 5 days.
2) Material from a CME is likely to impact Earth within 96 hours.
3) There is a possibility of either M or X class flares within the next 48 hours.
Green: 0-20% probability, Yellow: 20-60% probability, Red: 60-100% probability.
Compare to the previous day's image.
Data for all numbered solar regions according to the Solar Region Summary provided by NOAA/SEC. Comments are my own, as is the STAR spot count (spots observed at or inside a few hours before midnight) and data for regions not numbered by SEC or where SEC has observed no spots.
| Solar region | Date numbered | SEC spot count |
STAR spot count |
Location at midnight | Area | Classification | Comment |
|---|---|---|---|---|---|---|---|
| 10386 | 2003.06.16 | 3 | S06W62 | 0030 | HRX | now spotless | |
| 10387 | 2003.06.18 | 9 | 5 | N19W42 | 0170 | ESO |
area was 0120 at midnight |
| 10389 | 2003.06.20 | S12W64 | plage | ||||
| 10390 | 2003.06.22 | 5 | 3 | N14E23 | 0070 | CSO |
classification was HAX at midnight |
| 10391 | 2003.06.23 | 16 | 20 | N14W38 | 0190 | DAO |
area was 0130 at midnight |
| 10392 | 2003.06.24 | 1 | 2 | N06E43 | 0010 | HRX |
classification was HSX at midnight, area 0020 |
| 10393 | 2003.06.24 | 5 | 4 | S18E43 | 0050 | CAO |
classification was CSO at midnight |
| 10394 | 2003.06.26 | 2 | 3 | N08E22 | 0010 | AXX |
classification was DSO at midnight, area 0030 |
| 10395 | 2003.06.26 | 1 | 2 | N10E62 | 0060 | HSX | formerly region S193 |
| S192 | emerged on 2003.06.23 |
N05W31 | plage | ||||
| S194 | emerged on 2003.06.26 |
5 | S04E01 | 0060 | DAO | ||
| S195 | visible on 2003.06.26 |
1 | N09E85 | 0300 | HKX | ||
| Total spot count: | 42 | 45 | |||||
| SSN: | 122 | 135 | |||||
| Month | Average solar flux at Earth |
International sunspot number | Smoothed sunspot number |
|---|---|---|---|
| 2000.04 | 184.2 | 125.5 | 120.8 cycle 23 sunspot max. |
| 2000.07 | 202.3 | 170.1 | 119.8 |
| 2001.12 | 235.1 | 132.2 | 114.6 (-0.9) |
| 2002.05 | 178.4 | 120.8 | 108.8 (-1.7) |
| 2002.06 | 148.7 | 88.3 | 106.2 (-2.6) |
| 2002.07 | 173.5 | 99.6 | 102.7 (-3.5) |
| 2002.08 | 183.6 | 116.4 | 98.7 (-4.0) |
| 2002.09 | 175.8 | 109.6 | 94.6 (-4.1) |
| 2002.10 | 167.0 | 97.5 | 90.5 (-4.1) |
| 2002.11 | 168.7 | 95.5 | 85.2 (-5.3) |
| 2002.12 | 157.2 | 80.8 | (81.4 predicted, -3.8) |
| 2003.01 | 144.0 | 79.5 | (78.3 predicted, -3.1) |
| 2003.02 | 124.5 | 46.2 | (73.3 predicted, -5.0) |
| 2003.03 | 131.4 | 61.5 | (67.6 predicted, -5.7) |
| 2003.04 | 126.4 | 60.0 | (62.7 predicted, -4.9) |
| 2003.05 | 115.7 | 55.2 | (57.8 predicted, -4.9) |
| 2003.06 | 129.9 (1) | 100.1 (2) | (53.8 predicted, -4.0) |
1) Running average based on the daily 20:00 UTC observed solar flux value at 2800 MHz.
2) Unofficial, accumulated value based on the Boulder (NOAA/SEC) sunspot number. The official international sunspot number is typically
30-50% less.
This report has been prepared by Jan Alvestad. It is based partly on my own observations and interpretations, and partly on data from sources noted in solar links. All time references are to the UTC day. Comments and suggestions are always welcome.
| [DX-Listeners' Club] |