
Last update issued on May 30, 2003 at 03:00 UTC. Minor update posted at 17:35 UTC.
[Solar and geomagnetic data - last 4 weeks (updated daily)]
[Solar wind and electron fluence charts (updated daily)]
[Solar cycles 21-23 (last update May 1, 2003)]
[Solar cycles 1-20]
[Graphical comparison of cycles 21, 22 and 23 (last update May 1, 2003)]
[Graphical comparison of cycles 10, 13, 17, 20 and 23 (last update May 1, 2003)]
[Historical solar and geomagnetic data charts 1954-2003 (last update April 13, 2003)]
[Archived reports (last update May 26, 2003)]
The geomagnetic field was unsettled to very severe storm on May 29. Solar wind speed ranged between 565 and 814 km/sec. A solar wind shock was observed at 11:52 UTC at SOHO with a sudden increase in solar wind speed from 567 to 689 km/sec. The source of this disturbance was likely a full halo CME (transit time: 53 hours) observed after a long duration M1.6 event in region S169 on May 27. Another and very strong solar wind shock was observed at 18:34 UTC when solar wind speed increased abruptly from 691 to 763 km/sec. This shock was caused by the arrival of the 2 halo CMEs (transit time: 43-44 hours) observed after the X1 flare late on May 27 and X3 flare early on May 28. The interplanetary magnetic field was soon after the arrival of this disturbance extremely strongly southwards and caused very severe geomagnetic storm conditions with the planetary A index for the 21-24h UTC interval reaching 231.
Solar flux measured at 17h UTC on 2.8 GHz was 124.3 (the measurement at 20h UTC was enhanced by an M flare in region 10368). The planetary A
index was 89 (STAR Ap - based on the mean of three hour interval ap indices: 91.4).
Three hour interval K indices: 54436788 (planetary), 53435687 (Boulder).
The background x-ray flux is at the class B3 level.
The above 10 MeV proton flux peaked near the 110 pfu level during the evening. The proton event ended early on May 30 when the proton flux dropped below the 10 pfu level.
At midnight there were 4 spotted regions on the visible disk. Solar flare activity was high. A total of 1 C, 2 M and 1 X class events was recorded during the day.
Region 10367 decayed further and had only a single tiny spot left by midnight.
Region 10368 decayed losing penumbral area. :
M1.5/1F (associated with a weak type IV radio sweep) at 02:18, C1.2 at 05:19 and an M2.8/1N (associated with strong type II and IV
radio sweeps and a minor CME) flare at 19:37 UTC.
Region 10373 was quiet and stable.
Spotted regions not numbered or misnumbered by NOAA/SEC:
[S169] This region emerged very quickly after noon on May 24 in the southeast quadrant about 11 degrees longitude east of
spotless region 10365. The region continued to develop quickly as a compact region on May 25-28. On May 29 the region began to
decay and is currently not nearly as impressive as it was when it peaked on May 28. While further major flare are possible during
the decay phase, the region is much more quiet than just a day ago. Location at midnight: S07W46. Flare:
X1.2/2B (associated with a strong type II and a weak type IV radio sweep) at 01:05 UTC.
Comment added at 17:35 UTC on May 30: A solar wind shock was observed at SOHO at 16:00 UTC with an abrupt increase in solar wind speed from 610 to 780 km/sec. This shock was likely the arrival of the full halo CME observed early on May 29 after an X1.2 flare in region S169. The interplanetary magnetic field, having been mostly northwards since 02h UTC, swung strongly southwards at first. Currently the IMF is northwards again.
May 27: A full halo CME was observed in LASCO C3 images starting at 07:42 UTC. This was likely associated with a long
duration M1.6 event (peaked at 06:26 UTC) in region S169. The CME could reach Earth on May 29 but may be overtaken by another
(larger and faster) CME.
Another full halo CME was first observed in a LASCO C2 image at 23:50 UTC. This CME was associated with an X1.3 flare in region S169
and will likely reach Earth during the latter half of May 29.
May 28: The X3.9 flare in region S169 early in the day was associated with a fairly large full halo CME first observed in LASCO C2 at 00:50 UTC. This CME will likely arrive together with the CME observed one hour earlier and could cause a complex geomagnetic disturbance late on May 29 and on May 30.
May 29: Another large full halo CME was observed early in the day after an X1.1 flare in region S169. This CME will probably arrive at Earth during the latter half of May 30.
Coronal hole history (since late October 2002)
Compare today's report with the situation one solar rotation ago: 28
days ago 27 days ago 26
days ago
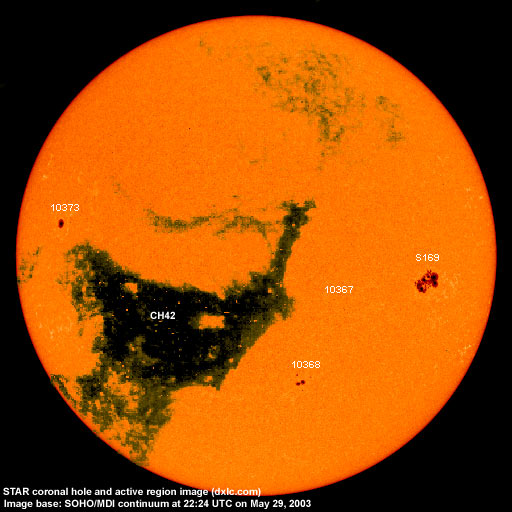
A large recurrent coronal hole (CH42) in the southern hemisphere will rotate into a geoeffective position on May 29-June 2. This coronal hole has a narrow leading extension into the northern hemisphere.
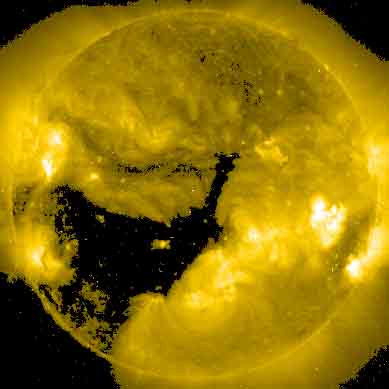
Processed SOHO EIT 284 image at 19:06 UTC on May 29. Any black areas on the solar disk are likely coronal holes.
The geomagnetic field is expected to be active to severe storm on May 30-31 due to CME effects. A high speed stream from coronal hole CH42 will likely arrive on June 1 and cause unsettled to minor storm conditions lasting until June 6.
Long distance medium wave (AM) band propagation along east-west paths over high and upper middle latitudes is useless and will likely be very poor to useless until at least June 8. Propagation along north-south paths is very poor. [Trans Atlantic propagation conditions are currently monitored every night on 1470 kHz. Dominant station tonight: none, only a faint unidentified signal noted at local sunrise.]
| Coronal holes (1) | Coronal mass ejections (2) | M and X class flares (3) |
1) Effects from a coronal hole could reach Earth within the next 5 days.
2) Material from a CME is likely to impact Earth within 96 hours.
3) There is a possibility of either M or X class flares within the next 48 hours.
Green: 0-20% probability, Yellow: 20-60% probability, Red: 60-100% probability.
Compare to the previous day's image.
Data for all numbered solar regions according to the Solar Region Summary provided by NOAA/SEC. Comments are my own, as is the STAR spot count (spots observed at or inside a few hours before midnight) and data for regions not numbered by SEC or where SEC has observed no spots.
| Solar region | Date numbered | SEC spot count |
STAR spot count |
Location at midnight | Area | Classification | Comment |
|---|---|---|---|---|---|---|---|
| 10365 | 2003.05.20 | 32 | S08W54 (SEC: S07W45) |
0880 | DKC |
location corrected the region is spotless, SECs spots belong to region S169. |
|
| 10366 | 2003.05.22 | N11W29 | plage | ||||
| 10367 | 2003.05.22 | 1 | 1 | S14W22 | 0010 | HSX |
classification was AXX at midnight, area 0000 |
| 10368 | 2003.05.22 | 11 | 8 | S32W15 | 0140 | DAO | beta-gamma |
| 10369 | 2003.05.23 | N12W73 | plage | ||||
| 10370 | 2003.05.23 | N16W26 | plage | ||||
| 10371 | 2003.05.27 | S13W36 | plage | ||||
| 10372 | 2003.05.27 | S14W29 | plage | ||||
| 10373 | 2003.05.27 | 3 | 3 | N08E53 | 0110 | CSO | |
| 10374 | 2003.05.28 | 1 | S22W72 | 0010 | AXX | now spotless | |
| S165 | emerged on 2003.05.21 |
S13W76 | plage | ||||
| S169 | emerged on 2003.05.24 |
40 | S07W46 | 0650 | DKC |
beta-gamma-delta (see region 10365) |
|
| S171 | emerged on 2003.05.28 |
S23W11 | now spotless | ||||
| S172 | emerged on 2003.05.28 |
S17E08 | now spotless | ||||
| S173 | emerged on 2003.05.28 |
N05E31 | now spotless | ||||
| Total spot count: | 48 | 52 | |||||
| SSN: | 98 | 92 | |||||
| Month | Average solar flux at Earth |
International sunspot number | Smoothed sunspot number |
|---|---|---|---|
| 2000.04 | 184.2 | 125.5 | 120.8 cycle 23 sunspot max. |
| 2000.07 | 202.3 | 170.1 | 119.8 |
| 2001.12 | 235.1 | 132.2 | 114.6 (-0.9) |
| 2002.04 | 189.8 | 120.7 | 110.5 (-2.9) |
| 2002.05 | 178.4 | 120.8 | 108.8 (-1.7) |
| 2002.06 | 148.7 | 88.3 | 106.2 (-2.6) |
| 2002.07 | 173.5 | 99.6 | 102.7 (-3.5) |
| 2002.08 | 183.6 | 116.4 | 98.7 (-4.0) |
| 2002.09 | 175.8 | 109.6 | 94.6 (-4.1) |
| 2002.10 | 167.0 | 97.5 | 90.5 (-4.1) |
| 2002.11 | 168.7 | 95.5 | (84.9 predicted, -5.6) |
| 2002.12 | 157.2 | 80.8 | (80.5 predicted, -4.4) |
| 2003.01 | 144.0 | 79.5 | (77.5 predicted, -3.0) |
| 2003.02 | 124.5 | 46.2 | (72.4 predicted, -5.1) |
| 2003.03 | 131.4 | 61.5 | (66.8 predicted, -5.6) |
| 2003.04 | 126.4 | 60.0 | (61.9 predicted, -4.9) |
| 2003.05 | 115.8 (1) | 86.1 (2) | (57.9 predicted, -4.0) |
1) Running average based on the daily 20:00 UTC observed solar flux value at 2800 MHz.
2) Unofficial, accumulated value based on the Boulder (NOAA/SEC) sunspot number. The official international sunspot number is typically
30-50% less.
This report has been prepared by Jan Alvestad. It is based partly on my own observations and interpretations, and partly on data from sources noted in solar links. All time references are to the UTC day. Comments and suggestions are always welcome.
| [DX-Listeners' Club] |