
Last update issued on March 13, 2003 at 03:15 UTC.
[Solar and geomagnetic data
- last 4 weeks (updated daily)]
[Solar wind and electron
fluence charts (updated daily)]
[Solar cycles 21-23 (last
update March 3, 2003)]
[Solar cycles 1-20]
[Graphical comparison of
cycles 21, 22 and 23 (last update March 3, 2003)]
[Graphical comparison of
cycles 10, 13, 17, 20 and 23 (last update March 3, 2003)]
[Historical solar and geomagnetic
data charts 1954-2002 (last update January 27, 2003)]
[Archived reports (last update March 10, 2003)]
The geomagnetic field was quiet to unsettled on March 12. Solar wind speed ranged between 401 and 552 km/sec. A high speed stream appears to have been in progress since just after 22h UTC at ACE.
Solar flux measured at 20h UTC on 2.8 GHz was 138.0. The planetary A
index was 9 (STAR Ap - based on the mean of three hour interval ap indices: 9.9).
Three hour interval K indices: 22223333 (planetary), 22213323 (Boulder).
The background x-ray flux is at the class B2-B3 level.
At midnight there were 3 spotted regions on the visible disk. Solar flare activity was very low.
Region 10300 decayed quickly during the latter half of the day.
Region 10306 developed slowly adding several small spots. At least C class flares are possible.
Region 10311 decayed fairly quickly. The positive and negative polarity areas are currently well separated and further
decay is likely.
March 9-11: No obviously geoeffective CMEs observed.
Coronal hole history (since late October 2002)
Compare today's report with the situation one solar rotation ago: 28
days ago 27 days ago 26
days ago
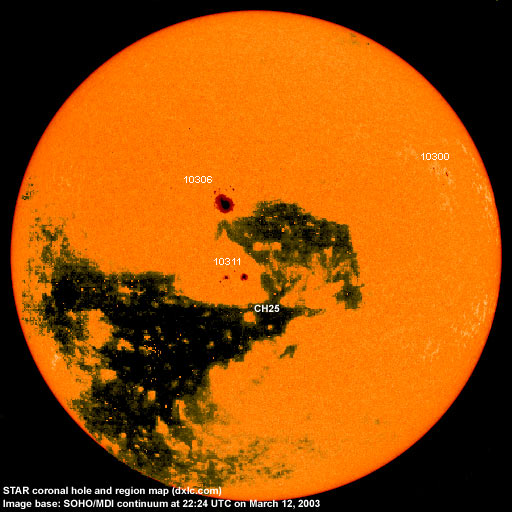
A well defined, large, recurrent coronal hole (CH25) will rotate into a geoeffective position on March 11-17. This coronal hole has developed in the northwestern trans equatorial part but seems to have lost the long trans equatorial extension further east.
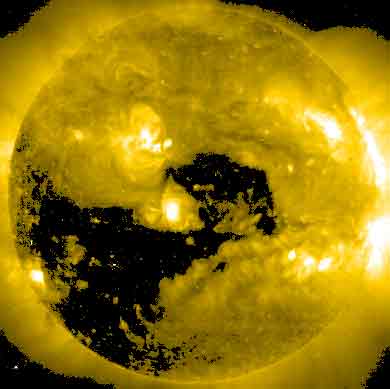
Processed SOHO EIT 284 image at 19:06 UTC on March 12. Any black areas on the solar disk are likely coronal holes.
The geomagnetic field is expected to be unsettled to minor storm on March 13 as a high speed coronal hole stream begins to dominate the solar wind. Unsettled to active conditions will then be likely March 14-20. Long distance medium wave (AM) band propagation along east-west paths over high and upper middle latitudes is poor, propagation along north-south paths is fair to good. [Trans Atlantic propagation conditions are currently monitored every night on 1470 kHz. Dominant station tonight: Radio Cristal del Uruguay.]
| Coronal holes (1) | Coronal mass ejections (2) | M and X class flares (3) |
1) Effects from a coronal hole could reach Earth within the
next 5 days.
2) Material from a CME is likely to impact Earth within 96 hours.
3) There is a possibility of either M or X class flares within the next 48
hours.
Green: 0-20% probability, Yellow: 20-60% probability, Red: 60-100% probability.
Compare to the previous day's image.
Data for all numbered solar regions according to the Solar Region Summary provided by SEC/NOAA. Comments are my own, as is the STAR spot count (spots observed at or inside a few hours before midnight) and data for regions not numbered by SEC or where SEC has observed no spots.
| Solar region | Date numbered | SEC spot count |
STAR spot count |
Location at midnight | Area | Classification | Comment |
|---|---|---|---|---|---|---|---|
| 10296 | 2003.02.28 | 1 | N12W85 | 0220 | HHX | rotated out of view | |
| 10297 | 2003.03.01 | 2 | S11W80 | rotated out of view | |||
| 10299 | 2003.03.03 | N14W74 | plage | ||||
| 10300 | 2003.03.03 | 9 | 4 | N16W51 | 0040 | CAO | |
| 10301 | 2003.03.04 | N22W71 | plage | ||||
| 10302 | 2003.03.04 | N20W30 | plage | ||||
| 10304 | 2003.03.07 | 6 | S13W86 | 0020 | HSX |
the spots belong to 10297, this region should be deleted |
|
| 10305 | 2003.03.07 | S22W39 | plage | ||||
| 10306 | 2003.03.07 | 8 | 11 | N06E08 | 0590 | DKO |
classification was EKO at midnight. STAR spot count includes region 10308 |
| 10307 | 2003.03.08 | S26W55 | plage | ||||
| 10308 | 2003.03.08 | 1 | N10E21 | 0010 | HRX |
this is a trailing negative polarity spot of region 10306 |
|
| 10310 | 2003.03.09 | S16W88 | plage | ||||
| 10311 | 2003.03.09 | 12 | 10 | S12E05 | 0100 | DSO |
classification was DAO at midnight |
| 10312 | 2003.03.10 | N09W51 | plage | ||||
| S117 | visible on 2003.03.02 |
S25W56 | plage | ||||
| S119 | emerged on 2003.03.04 |
S15W89 | plage | ||||
| S121 | emerged on 2003.03.07 |
S20W67 | plage | ||||
| Total spot count: | 39 | 25 | |||||
| SSN: | 109 | 55 | |||||
| Month | Average solar flux at Earth |
International sunspot number | Smoothed sunspot number |
|---|---|---|---|
| 2000.04 | 184.2 | 125.5 | 120.8 cycle 23 sunspot max. |
| 2000.07 | 202.3 | 170.1 | 119.8 |
| 2001.12 | 235.1 | 132.2 | 114.6 (-0.9) |
| 2002.02 | 205.0 | 107.4 | 114.6 (+1.2) |
| 2002.03 | 179.5 | 98.4 | 113.3 (-1.3) |
| 2002.04 | 189.8 | 120.7 | 110.5 (-2.9) |
| 2002.05 | 178.4 | 120.8 | 108.8 (-1.7) |
| 2002.06 | 148.7 | 88.3 | 106.2 (-2.6) |
| 2002.07 | 173.5 | 99.6 | 102.7 (-3.5) |
| 2002.08 | 183.6 | 116.4 | 98.7 (-4.0) |
| 2002.09 | 175.8 | 109.6 | (94.7 predicted, -4.0) |
| 2002.10 | 167.0 | 97.5 | (91.2 predicted, -3.5) |
| 2002.11 | 168.7 | 95.0 | (86.0 predicted, -5.2) |
| 2002.12 | 157.2 | 81.6 | (81.6 predicted, -4.4) |
| 2003.01 | 144.0 | 79.5 | (78.6 predicted, -3.0) |
| 2003.02 | 124.5 | 46.2 | (73.6 predicted, -5.0) |
| 2003.03 | 145.0 (1) | 57.3 (2) | (67.9 predicted, -5.7) |
1) Running average based on the daily 20:00 UT observed solar flux value at 2800
MHz.
2) Unofficial, accumulated value based on the Boulder (SEC/NOAA) sunspot number. The official
international sunspot number is typically 25-45% less.
This report has been prepared by Jan Alvestad. It is based partly on my own observations and interpretations, and partly on data from sources noted in solar links. All time references are to the UTC day. Comments and suggestions are always welcome.
| [DX-Listeners' Club] |