
Last update issued on May 2, 2003 at 03:40 UTC.
[Solar and geomagnetic data - last 4 weeks (updated daily)]
[Solar wind and electron fluence charts (updated daily)]
[Solar cycles 21-23 (last update May 1, 2003)]
[Solar cycles 1-20]
[Graphical comparison of cycles 21, 22 and 23 (last update May 1, 2003)]
[Graphical comparison of cycles 10, 13, 17, 20 and 23 (last update May 1, 2003)]
[Historical solar and geomagnetic data charts 1954-2003 (last update April 13, 2003)]
[Archived reports (last update May 1, 2003)]
The geomagnetic field was unsettled to major storm on May 1. Solar wind speed ranged between 575 and 715 km/sec under the influence of a high speed stream from coronal hole CH37. The stream was weakening slowly towards the end of the day.
Solar flux measured at 20h UTC on 2.8 GHz was 148.7. The planetary A
index was 40 (STAR Ap - based on the mean of three hour interval ap indices: 39.6).
Three hour interval K indices: 65554443 (planetary), 65543343 (Boulder).
The background x-ray flux is at the class B5 level.
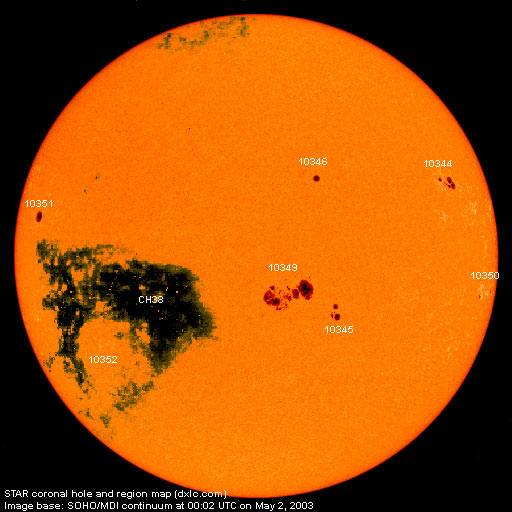
At midnight there were 7 spotted regions on the visible disk. Solar flare activity was low. A total of 14 C class events was recorded during the day. A C1.7 flare at 13:33 UTC and a C1.4 flare at 23:03 UTC probably had their origin in region 10337 at the southwest limb.
Region 10344 decayed during the first half of the day, then new spots began to emerge in the southeastern part of
region.
Region 10345 decayed slowly in the northern section and developed slowly in the southern section. The region has become
more complex and was the source of an M1.0 long duration event peaking at 03:08 UTC on May 2. Flare:
C1.7 long duration event peaking at 09:44 UTC.
Region 10346 was quiet and stable.
Region 10349 decayed slightly in the southern part of the trailing spot section but added some penumbral area in the
central section. The only magnetic complexity appears to be in the northern central section where the positive and negative
magnetic fields are somewhat intermixed. Otherwise the region is still relatively simple. Any emergence of opposite polarity flux
within either the negative leader spots or the positive trailing spots would substantially increase the probability of a major
flare. Flares: C1.1 at 01:11, C1.3 at 04:06, a C1.8 long duration event peaking at 08:17, C1.5
at 10:44, C5.3 at 11:43, C1.2 at 12:38, C1.1 at 14:01, C3.5 at 14:12, C1.8 at 18:47, C4.9 at 19:22 and C2.2 at 22:06 UTC.
Region 10350 decayed slowly and quietly and will soon be rotating over the southwest limb.
Region 10351 was quiet and stable.
New region 10352 emerged early on April 30 and was numbered by SEC one day later. The region decayed on May 1 and is likely
to become spotless soon.
April 29-May 1: No obviously geoeffective CMEs observed.
Coronal hole history (since late October 2002)
Compare today's report with the situation one solar rotation ago: 28
days ago 27 days ago 26
days ago
A recurrent coronal hole (CH38) in the southern hemisphere will rotate into a geoeffective position on May 3-5.

Processed SOHO EIT 284 image at 19:06 UTC on May 1. Any black areas on the solar disk are likely coronal holes.
The geomagnetic field is expected to be quiet to active on May 2-3 and quiet to unsettled May 4-5. Late on May 5 or early on May 6 a high speed stream from coronal hole CH38 will begin dominating the solar wind and cause unsettled to minor storm conditions until May 9. Long distance medium wave (AM) band propagation along east-west paths over high and upper middle latitudes is useless to very poor. Propagation along north-south paths is fair. [Trans Atlantic propagation conditions are currently monitored every night on 1470 kHz. Dominant station tonight: Radio Cristal del Uruguay at first, then Cadena Peruana de Noticias with a strong signal.]
| Coronal holes (1) | Coronal mass ejections (2) | M and X class flares (3) |
1) Effects from a coronal hole could reach Earth within the next 5 days.
2) Material from a CME is likely to impact Earth within 96 hours.
3) There is a possibility of either M or X class flares within the next 48 hours.
Green: 0-20% probability, Yellow: 20-60% probability, Red: 60-100% probability.
Compare to the previous day's image.
Data for all numbered solar regions according to the Solar Region Summary provided by SEC/NOAA. Comments are my own, as is the STAR spot count (spots observed at or inside a few hours before midnight) and data for regions not numbered by SEC or where SEC has observed no spots.
| Solar region | Date numbered | SEC spot count |
STAR spot count |
Location at midnight | Area | Classification | Comment |
|---|---|---|---|---|---|---|---|
| 10337 | 2003.04.18 | 1 | S16W92 | 0060 | HSX | rotated out of view | |
| 10340 | 2003.04.21 | S07W78 (SEC: S12W79) |
plage | ||||
| 10341 | 2003.04.21 | S10W54 | plage | ||||
| 10343 | 2003.04.23 | N07W49 | plage | ||||
| 10344 | 2003.04.24 | 10 | 13 | N15W54 | 0210 | DAO | beta-gamma |
| 10345 | 2003.04.24 | 7 | 10 | S17W19 | 0120 | DAO | |
| 10346 | 2003.04.24 | 1 | 1 | N15W15 | 0060 | HSX | |
| 10347 | 2003.04.26 | S18W28 | plage | ||||
| 10348 | 2003.04.26 | 2 | S34W01 | 0010 | AXX | now spotless | |
| 10349 | 2003.04.26 | 51 | 70 | S14W06 | 1020 | EKC | beta-gamma |
| 10350 | 2003.04.30 | 5 | 4 | S11W70 | 0060 | DAO | |
| 10351 | 2003.04.30 | 1 | 1 | N08E65 | 0150 | HAX | |
| 10352 | 2003.05.01 | 3 | 1 | S24E43 | 0020 | BXO |
formerly region S148 classification was AXX at midnight, area 0000 |
| S147 | emerged on 2003.04.28 |
S17W45 | plage | ||||
| Total spot count: | 81 | 100 | |||||
| SSN: | 171 | 170 | |||||
| Month | Average solar flux at Earth |
International sunspot number | Smoothed sunspot number |
|---|---|---|---|
| 2000.04 | 184.2 | 125.5 | 120.8 cycle 23 sunspot max. |
| 2000.07 | 202.3 | 170.1 | 119.8 |
| 2001.12 | 235.1 | 132.2 | 114.6 (-0.9) |
| 2002.04 | 189.8 | 120.7 | 110.5 (-2.9) |
| 2002.05 | 178.4 | 120.8 | 108.8 (-1.7) |
| 2002.06 | 148.7 | 88.3 | 106.2 (-2.6) |
| 2002.07 | 173.5 | 99.6 | 102.7 (-3.5) |
| 2002.08 | 183.6 | 116.4 | 98.7 (-4.0) |
| 2002.09 | 175.8 | 109.6 | 94.6 (-4.1) |
| 2002.10 | 167.0 | 97.5 | 90.5 (-4.1) |
| 2002.11 | 168.7 | 95.0 | (84.9 predicted, -5.6) |
| 2002.12 | 157.2 | 81.6 | (80.5 predicted, -4.4) |
| 2003.01 | 144.0 | 79.5 | (77.5 predicted, -3.0) |
| 2003.02 | 124.5 | 46.2 | (72.4 predicted, -5.1) |
| 2003.03 | 131.4 | 61.5 | (66.8 predicted, -5.6) |
| 2003.04 | 126.4 | 60.0 | (61.9 predicted, -4.9) |
| 2003.05 | 148.7 (1) | 5.5 (2) | (57.9 predicted, -4.0) |
1) Running average based on the daily 20:00 UTC observed solar flux value at 2800 MHz.
2) Unofficial, accumulated value based on the Boulder (SEC/NOAA) sunspot number. The official international sunspot number is typically 25-45% less.
This report has been prepared by Jan Alvestad. It is based partly on my own observations and interpretations, and partly on data from sources noted in solar links. All time references are to the UTC day. Comments and suggestions are always welcome.
| [DX-Listeners' Club] |