
Last update issued on May 27, 2003 at 03:10 UTC.
[Solar and geomagnetic data - last 4 weeks (updated daily)]
[Solar wind and electron fluence charts (updated daily)]
[Solar cycles 21-23 (last update May 1, 2003)]
[Solar cycles 1-20]
[Graphical comparison of cycles 21, 22 and 23 (last update May 1, 2003)]
[Graphical comparison of cycles 10, 13, 17, 20 and 23 (last update May 1, 2003)]
[Historical solar and geomagnetic data charts 1954-2003 (last update April 13, 2003)]
[Archived reports (last update May 26, 2003)]
The geomagnetic field was unsettled to active on May 26. Solar wind speed ranged between 440 and 539 km/sec. A high speed stream from coronal hole CH41 was observed beginning at ACE at approximately 23:30 UTC.
Solar flux measured at 20h UTC on 2.8 GHz was 125.1. The planetary A
index was 18 (STAR Ap - based on the mean of three hour interval ap indices: 19.5).
Three hour interval K indices: 43433334 (planetary), 42423334 (Boulder).
The background x-ray flux is at the class B6 level.
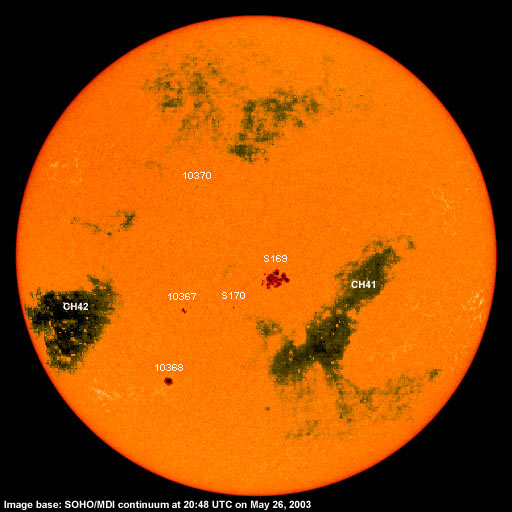
At midnight there were 5 spotted regions on the visible disk. Solar flare activity was moderate. A total of 5 C and 2 M class events was recorded during the day. A region just behind the northeast limb displayed quite a bit of activity during the day. Flares: Long duration C6.0 event (associated with a CME) peaking at 06:42 and C1.5 at 22:46 UTC.
Region 10367 was mostly quiet and stable. Flare: C1.0 at 11:28 UTC.
Region 10368 was mostly quiet and stable.
Region 10370 decayed slowly and could soon become spotless again.
Spotted regions not numbered by SEC/NOAA:
[S169] A new region emerged very quickly after noon on May 24 in the southeast quadrant about 11 degrees longitude east of
spotless region 10365. The region continued to develop quickly as a compact region on May 25 and 26 and is currently a complex
region with a strong magnetic delta structure along most of the main inversion line. The negative polarity spots are nearly
surrounded by positive polarity flux. Further M class flares are almost certain and there is a fairly good chance of an X class
flare as well. Location at midnight: S06W06. Flares: M1.9/1F at 05:50, C5.9 at 15:20, M1.0/1F
at 16:37 and a long duration C7.4 event peaking at 17:44 UTC.
[S170] A new region emerged in the southeast quadrant on May 26 due west of region 10367. Spots midway between the
westernmost spots in this region and region 10367 probably belong to this region but may have to be split off into a separate
region. Location at midnight: S14E07.
May 24-25: No obviously geoeffective CMEs observed.
May 26: A partial CME was observed in LASCO C2 images starting at 06:50 UTC with the first appearance of ejected
material above the northeast limb. Later on the CME expanded to include the entire east limb and a portion of the northwest limb.
The source of this CME was probably backsided as a long duration C6 event was observed from a region just behind the northeast
limb. It is therefore unlikely that the CME will become geoeffective.
A complex sequence of CMEs was observed during the evening. A CME where the first ejected material was observed above the north
pole at 18:06 UTC may have been associated with a long duration event in region S169. This event will have to be analyzed further
to determine if it could become geoeffective.
Coronal hole history (since late October 2002)
Compare today's report with the situation one solar rotation ago: 28
days ago 27 days ago 26
days ago
A recurrent coronal hole (CH41) in the southern hemisphere was in a geoeffective position on May 24-25. A large recurrent coronal hole (CH42) in the southern hemisphere will rotate into a geoeffective position on May 30-June 1.

Processed SOHO EIT 284 image at 19:06 UTC on May 26. Any black areas on the solar disk are likely coronal holes.
The geomagnetic field is expected to be unsettled to minor storm on May 27-28 due to a high speed stream from coronal hole CH41. Quiet to active is expected for May 29 becoming quiet to unsettled on May 30-31.
Long distance medium wave (AM) band propagation along east-west paths over high and upper middle latitudes is very poor and will likely stay very poor until at least May 29. Propagation along north-south paths is fair. [Trans Atlantic propagation conditions are currently monitored every night on 1470 kHz. Dominant station tonight: none, two unidentified stations from Brazil was noted.]
| Coronal holes (1) | Coronal mass ejections (2) | M and X class flares (3) |
1) Effects from a coronal hole could reach Earth within the next 5 days.
2) Material from a CME is likely to impact Earth within 96 hours.
3) There is a possibility of either M or X class flares within the next 48 hours.
Green: 0-20% probability, Yellow: 20-60% probability, Red: 60-100% probability.
Compare to the previous day's image.
Data for all numbered solar regions according to the Solar Region Summary provided by SEC/NOAA. Comments are my own, as is the STAR spot count (spots observed at or inside a few hours before midnight) and data for regions not numbered by SEC or where SEC has observed no spots.
| Solar region | Date numbered | SEC spot count |
STAR spot count |
Location at midnight | Area | Classification | Comment |
|---|---|---|---|---|---|---|---|
| 10362 | 2003.05.15 | S10W70 | plage | ||||
| 10365 | 2003.05.20 | 18 | S08W15 (SEC: S06W06) |
0210 | DAI |
location corrected the region is spotless, SECs spots belong to region S169. |
|
| 10366 | 2003.05.22 | N11E10 | plage | ||||
| 10367 | 2003.05.22 | 3 | 5 | S14E17 | 0050 | CAO | |
| 10368 | 2003.05.22 | 1 | 2 | S32E24 | 0120 | HAX |
classification was CAO at midnight |
| 10369 | 2003.05.23 | N12W34 | plage | ||||
| 10370 | 2003.05.23 | 3 | 4 | N16E13 | 0020 | CRO |
classification was BXO at midnight, area 0010 |
| S165 | emerged on 2003.05.21 |
S13W24 | plage | ||||
| S169 | emerged on 2003.05.24 |
51 | S06W06 | 0480 | DKC | gamma-delta | |
| S170 | emerged on 2003.05.26 |
4 | S14E07 | 0020 | CRO | ||
| Total spot count: | 25 | 66 | |||||
| SSN: | 65 | 116 | |||||
| Month | Average solar flux at Earth |
International sunspot number | Smoothed sunspot number |
|---|---|---|---|
| 2000.04 | 184.2 | 125.5 | 120.8 cycle 23 sunspot max. |
| 2000.07 | 202.3 | 170.1 | 119.8 |
| 2001.12 | 235.1 | 132.2 | 114.6 (-0.9) |
| 2002.04 | 189.8 | 120.7 | 110.5 (-2.9) |
| 2002.05 | 178.4 | 120.8 | 108.8 (-1.7) |
| 2002.06 | 148.7 | 88.3 | 106.2 (-2.6) |
| 2002.07 | 173.5 | 99.6 | 102.7 (-3.5) |
| 2002.08 | 183.6 | 116.4 | 98.7 (-4.0) |
| 2002.09 | 175.8 | 109.6 | 94.6 (-4.1) |
| 2002.10 | 167.0 | 97.5 | 90.5 (-4.1) |
| 2002.11 | 168.7 | 95.5 | (84.9 predicted, -5.6) |
| 2002.12 | 157.2 | 80.8 | (80.5 predicted, -4.4) |
| 2003.01 | 144.0 | 79.5 | (77.5 predicted, -3.0) |
| 2003.02 | 124.5 | 46.2 | (72.4 predicted, -5.1) |
| 2003.03 | 131.4 | 61.5 | (66.8 predicted, -5.6) |
| 2003.04 | 126.4 | 60.0 | (61.9 predicted, -4.9) |
| 2003.05 | 114.4 (1) | 75.5 (2) | (57.9 predicted, -4.0) |
1) Running average based on the daily 20:00 UTC observed solar flux value at 2800 MHz.
2) Unofficial, accumulated value based on the Boulder (SEC/NOAA) sunspot number. The official international sunspot number is typically
30-50% less.
This report has been prepared by Jan Alvestad. It is based partly on my own observations and interpretations, and partly on data from sources noted in solar links. All time references are to the UTC day. Comments and suggestions are always welcome.
| [DX-Listeners' Club] |