
Last update issued on May 28, 2003 at 03:00 UTC. Minor update posted at 13:28 UTC.
[Solar and geomagnetic data - last 4 weeks (updated daily)]
[Solar wind and electron fluence charts (updated daily)]
[Solar cycles 21-23 (last update May 1, 2003)]
[Solar cycles 1-20]
[Graphical comparison of cycles 21, 22 and 23 (last update May 1, 2003)]
[Graphical comparison of cycles 10, 13, 17, 20 and 23 (last update May 1, 2003)]
[Historical solar and geomagnetic data charts 1954-2003 (last update April 13, 2003)]
[Archived reports (last update May 26, 2003)]
The geomagnetic field was unsettled to minor storm on May 27. Solar wind speed ranged between 452 and 646 km/sec under the influence of a high speed stream from coronal hole CH41.
Solar flux measured at 20h UTC on 2.8 GHz was 128.8. The planetary A
index was 26 (STAR Ap - based on the mean of three hour interval ap indices: 26.0).
Three hour interval K indices: 44334345 (planetary), 44334435 (Boulder).
The background x-ray flux is at the class B4 level.
At midnight there were 4 spotted regions on the visible disk. Solar flare activity was high. A total of 2 C, 2 M and 1 X class events was recorded during the day.
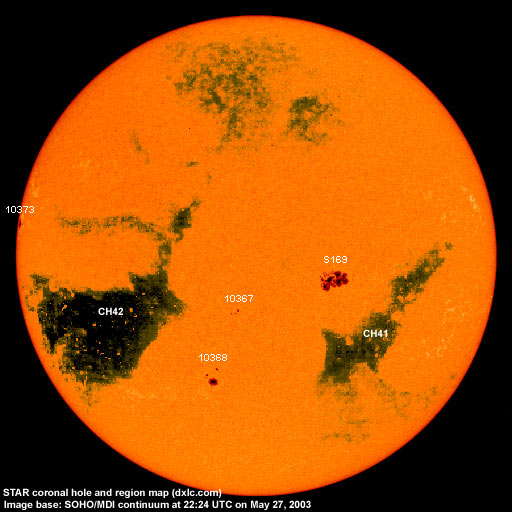
Region 10367 decayed somewhat with the main penumbra losing most of its area. A few new spots emerged.
Region 10368 developed slowly. New flux emerging just north of the main penumbra could be a separate region. As it is now
the region has some polarity intermixing and is likely to become more active. Flare: C1.7 at
01:22 UTC.
New region 10373 rotated into view at the northeast limb. This region was less active than when it was behind the limb one
day ago.
Spotted regions not numbered or misnumbered by NOAA/SEC:
[S169] A new region emerged very quickly after noon on May 24 in the southeast quadrant about 11 degrees longitude east of
spotless region 10365. The region continued to develop quickly as a compact region on May 25-27 and is currently a complex
region with magnetic delta structures both in the southeast and central western parts. Further X class flaring is likely. Location at midnight:
S07W20. Flares: M1.4/1F at 03:06, a long duration M1.6/1F event peaking at 06:26, C6.5 at
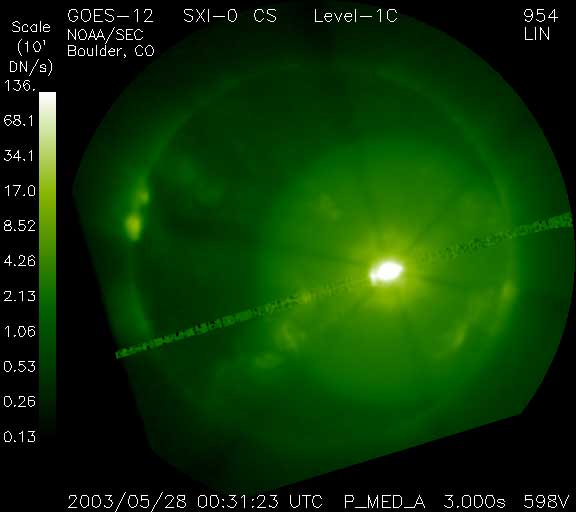
15:12 and a major impulsive X1.3 flare at 23:07 UTC. The X1 event was associated with a strong type II radio sweep. At 00:27 UTC
on May 28 this region produced an X3.9/2B flare (see GOES SXI image).
Comment added at 13:28 UTC on May 28: LASCO images between midnight and 04h UTC are not yet available, however, interpolation of C3 images before midnight and after 04h UTC indicate at least one fast full halo event following the X class events. A proton enhancement is currently in progress and the above 10 MeV proton flux has reached 3 pfu. Any further major flares are likely to cause significantly stronger particle events.
Region S169 has developed further and only a few spots are outside of the huge penumbral area measuring more than 800 mills at noon. The region currently has the potential for an X10+ proton flare.
The geomagnetic field was at minor to major storm levels during the first half of the day and the solar wind speed has levelled out near 700 km/sec.
May 25: No obviously geoeffective CMEs observed.
May 26: A partial CME was observed in LASCO C2 images starting at 06:50 UTC with the first appearance of ejected material above the northeast limb. Later on the CME expanded to include the entire east limb and a portion of the northwest limb. The source of this CME was probably backsided as a long duration C6 event was observed from a region just behind the northeast limb. It is therefore unlikely that the CME will become geoeffective.
May 27: A full halo CME was observed in LASCO C3 images starting at 07:42 UTC. This was likely associated with a long
duration M1.6 event (peaked at 06:26 UTC) in region S169. The CME could reach Earth on May 29 but may be overtaken by another
(larger and faster) CME.
Another full halo CME was observed in a LASCO C2 image near midnight. This CME was associated with an X1.3 flare in region S169
and appears to be a fast CME capable of reaching Earth during the first half of May 29.
May 28: The X3.9 flare in region S169 early in the day was likely associated with a large and fast Earth directed CME. As I write there are no available LASCO images from the hours after this event, and a better evaluation of the potential of the probable CME will have to wait. An update will likely be posted during the day.
Coronal hole history (since late October 2002)
Compare today's report with the situation one solar rotation ago: 28
days ago 27 days ago 26
days ago
A recurrent coronal hole (CH41) in the southern hemisphere was in a geoeffective position on May 24-25. A large recurrent coronal hole (CH42) in the southern hemisphere will rotate into a geoeffective position on May 29-June 2.

Processed SOHO EIT 284 image at 19:06 UTC on May 27. Any black areas on the solar disk are likely coronal holes.
The geomagnetic field is expected to be unsettled to major storm on May 28 due to a high speed stream from coronal hole CH41. CME impacts on May 29 will likely cause severe geomagnetic storming that day and on May 30. Unsettled to minor storm is expected for May 31. A high speed stream from coronal hole CH42 will likely arrive on June 1 and cause unsettled to minor storm conditions lasting until June 6.
Long distance medium wave (AM) band propagation along east-west paths over high and upper middle latitudes is very poor and will likely stay very poor until at least June 8. Propagation along north-south paths is poor to fair. [Trans Atlantic propagation conditions are currently monitored every night on 1470 kHz. Dominant station tonight: none, both Radio Cristal del Uruguay and Cadena Peruana de Noticias were observed at times.]
| Coronal holes (1) | Coronal mass ejections (2) | M and X class flares (3) |
1) Effects from a coronal hole could reach Earth within the next 5 days.
2) Material from a CME is likely to impact Earth within 96 hours.
3) There is a possibility of either M or X class flares within the next 48 hours.
Green: 0-20% probability, Yellow: 20-60% probability, Red: 60-100% probability.
Compare to the previous day's image.
Data for all numbered solar regions according to the Solar Region Summary provided by NOAA/SEC. Comments are my own, as is the STAR spot count (spots observed at or inside a few hours before midnight) and data for regions not numbered by SEC or where SEC has observed no spots.
| Solar region | Date numbered | SEC spot count |
STAR spot count |
Location at midnight | Area | Classification | Comment |
|---|---|---|---|---|---|---|---|
| 10362 | 2003.05.15 | S10W83 | plage | ||||
| 10365 | 2003.05.20 | 38 | S08W28 (SEC: S07W19) |
0400 | DKC |
location corrected the region is spotless, SECs spots belong to region S169. |
|
| 10366 | 2003.05.22 | N11W03 | plage | ||||
| 10367 | 2003.05.22 | 4 | 6 | S14E04 | 0030 | CAO |
classification was DAO at midnight |
| 10368 | 2003.05.22 | 8 | 6 | S32E11 | 0100 | CSO |
beta-gamma classification was DAO at midnight |
| 10369 | 2003.05.23 | N12W47 | plage | ||||
| 10370 | 2003.05.23 | N16E00 | plage | ||||
| 10371 | 2003.05.27 | 1 | S13W10 | 0010 | HSX |
formerly region S170 (western part) now spotless |
|
| 10372 | 2003.05.27 | 4 | S14W03 | 0020 | BXO |
formerly region S170 (eastern part) now spotless |
|
| 10373 | 2003.05.27 | 1 | 2 | N08E81 | 0120 | HAX |
classification was CAO at midnight |
| S165 | emerged on 2003.05.21 |
S13W50 | plage | ||||
| S169 | emerged on 2003.05.24 |
63 | S07W20 | 0670 | DKC |
gamma-delta (see region 10365) |
|
| Total spot count: | 56 | 77 | |||||
| SSN: | 116 | 117 | |||||
| Month | Average solar flux at Earth |
International sunspot number | Smoothed sunspot number |
|---|---|---|---|
| 2000.04 | 184.2 | 125.5 | 120.8 cycle 23 sunspot max. |
| 2000.07 | 202.3 | 170.1 | 119.8 |
| 2001.12 | 235.1 | 132.2 | 114.6 (-0.9) |
| 2002.04 | 189.8 | 120.7 | 110.5 (-2.9) |
| 2002.05 | 178.4 | 120.8 | 108.8 (-1.7) |
| 2002.06 | 148.7 | 88.3 | 106.2 (-2.6) |
| 2002.07 | 173.5 | 99.6 | 102.7 (-3.5) |
| 2002.08 | 183.6 | 116.4 | 98.7 (-4.0) |
| 2002.09 | 175.8 | 109.6 | 94.6 (-4.1) |
| 2002.10 | 167.0 | 97.5 | 90.5 (-4.1) |
| 2002.11 | 168.7 | 95.5 | (84.9 predicted, -5.6) |
| 2002.12 | 157.2 | 80.8 | (80.5 predicted, -4.4) |
| 2003.01 | 144.0 | 79.5 | (77.5 predicted, -3.0) |
| 2003.02 | 124.5 | 46.2 | (72.4 predicted, -5.1) |
| 2003.03 | 131.4 | 61.5 | (66.8 predicted, -5.6) |
| 2003.04 | 126.4 | 60.0 | (61.9 predicted, -4.9) |
| 2003.05 | 114.9 (1) | 79.2 (2) | (57.9 predicted, -4.0) |
1) Running average based on the daily 20:00 UTC observed solar flux value at 2800 MHz.
2) Unofficial, accumulated value based on the Boulder (NOAA/SEC) sunspot number. The official international sunspot number is typically
30-50% less.
This report has been prepared by Jan Alvestad. It is based partly on my own observations and interpretations, and partly on data from sources noted in solar links. All time references are to the UTC day. Comments and suggestions are always welcome.
| [DX-Listeners' Club] |