
Last update issued on October 19, 2003 at 01:35 UTC. Minor update posted at 17:43 UTC.
[Solar and geomagnetic data - last month (updated daily)]
[Solar wind and electron fluence charts (updated daily)]
[Solar cycles 21-23 (last update October 4, 2003)]
[Solar cycles 1-20]
[Graphical comparison of cycles 21, 22 and 23 (last update October 4, 2003)]
[Graphical comparison of cycles 2, 10, 13, 17, 20 and 23 (last update October
4, 2003)]
[Historical solar and geomagnetic data charts 1954-2003 (last update October 15, 2003)]
[Archived reports (last update October 15, 2003)]
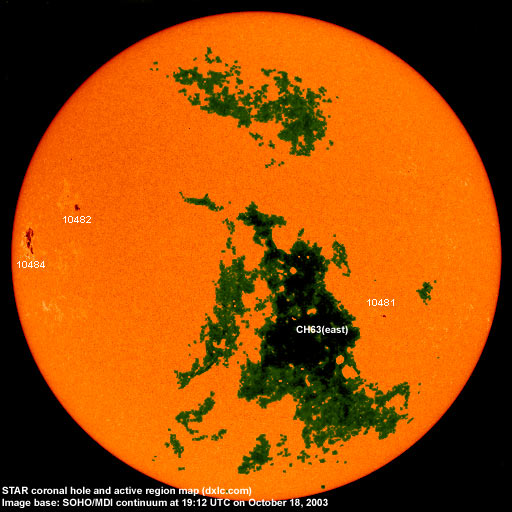
The geomagnetic field was unsettled to minor storm on October 18. Solar wind speed ranged between 479 and 588 km/sec under the influence of a high speed stream from coronal hole CH63.
Solar flux measured at 20h UTC on 2.8 GHz was 108-6. The planetary A
index was 27 (STAR Ap - based on the mean of three hour interval ap indices: 26.9).
Three hour interval K indices: 45444344 (planetary), 55433334 (Boulder).
The background x-ray flux is at the class C1 level.
At midnight there were 3 spotted regions on the visible disk. Solar flare activity was low. A total of 9 C class flares was recorded during the day.
Region 10481 decayed slowly and quietly.
Region 10482 decayed slightly and was quiet.
New region 10484 rotated into view at the northeast limb on October 17 and was numbered by SEC the next day. The region
developed very quickly along a north-south axis on October 18 and currently has two magnetic delta structures. A major flare is
possible, as is a proton flare. Flares: C2.0 at 05:38, C3.3 at 09:00, C3.3 at 15:22, C4.9 at
16:53, C2.6 at 17:15, C3.0 at 19:08, C3.3 at 20:41, C2.3 at 21:29 and C6.5/1F at 22:18 UTC.
Comment added at 17:42 UTC on October 19, 2003: Region 10484 produced a major X1.1 flare at 16:50 UTC. A recent LASCO C2 image displays a CME at the northeastern limb shortly after the flare peak. The region has maintained its extremely rapid development today and is approaching an area of 1000 mills. While negative polarity flux emerged at an impressive rate yesterday, positive polarity flux in the northwestern and southeastern part of the region has played the major role in today's development. The region has an enormous penumbra containing most of the spots and a very strong magnetic delta structure. Further X class flares are likely as long as the current structural layout remains mostly intact.
October 18: A halo CME was observed in LASCO C3 images beginning at 16:18 UTC and was likely associated with an event near the east limb. It is not yet certain if the event was associated with activity in region 10484 or another region behind the southeast limb.
October 16-17: No potentially geoeffective CMEs observed.
Coronal hole history (since late October 2002)
Compare today's report with the situation one solar rotation ago: 28
days ago 27 days ago 26 days ago
A recurrent trans equatorial hole (CH63) was in a geoeffective position on October 12-19.

Processed SOHO/EIT 284 image at 19:06 UTC on October 18. The darkest areas on the solar disk are likely coronal holes.
The geomagnetic field is expected to be unsettled to minor storm on October 18-21 due to a high speed stream from coronal hole CH63.
Long distance low frequency (below 2 MHz) propagation along east-west paths over high and upper middle latitudes is very poor. Propagation along north-south paths is poor. [Trans Atlantic propagation conditions are currently monitored every night on 1470 kHz. Dominant station tonight: Radio Cristal del Uruguay. An unidentified station from Brazil was noted as well].
| Coronal holes (1) | Coronal mass ejections (2) | M and X class flares (3) |
 |
|
 |
1) Effects from a coronal hole could reach Earth within the next 5 days.
2) Material from a CME is likely to impact Earth within 96 hours.
3) There is a possibility of either M or X class flares within the next 48 hours.
Green: 0-20% probability, Yellow: 20-60% probability, Red: 60-100% probability.
Compare to the previous day's image.
Data for all numbered solar regions according to the Solar Region Summary provided by NOAA/SEC. Comments are my own, as is the STAR spot count (spots observed at or inside a few hours before midnight) and data for regions not numbered by SEC or where SEC has observed no spots.
| Solar region | Date numbered | SEC spot count |
STAR spot count |
Location at midnight | Area | Classification | Comment |
|---|---|---|---|---|---|---|---|
| 10479 | 2003.10.10 | 4 | N25W44 | 0020 | CSO | spotless | |
| 10480 | 2003.10.15 | N21W65 | |||||
| 10481 | 2003.10.17 | 8 | 3 | S08W32 | 0030 | CSO |
classification was HAX at midnight |
| 10482 | 2003.10.17 | 8 | 4 | N17E47 | 0050 | CAO | |
| 10483 | 2003.10.17 | 1 | S08E55 | 0010 | AXX |
formerly region S280 spotless |
|
| 10484 | 2003.10.17 | 20 | 23 | N05E68 | 0240 | DAC |
beta-gamma-delta formerly region S279 classification was DKC at midnight, are 0460 |
| S273 | emerged on 2003.10.08 |
N13W73 | plage | ||||
| Total spot count: | 51 | 30 | |||||
| SSN: | 101 | 60 | |||||
| Month | Average solar flux at Earth |
International sunspot number | Smoothed sunspot number |
|---|---|---|---|
| 2000.04 | 184.2 | 125.5 | 120.8 cycle 23 sunspot max. |
| 2000.07 | 202.3 | 170.1 | 119.8 |
| 2001.12 | 235.1 | 132.2 | 114.6 (-0.9) |
| 2002.09 | 175.8 | 109.6 | 94.6 (-4.1) |
| 2002.10 | 167.0 | 97.5 | 90.5 (-4.1) |
| 2002.11 | 168.7 | 95.5 | 85.2 (-5.3) |
| 2002.12 | 157.2 | 80.8 | 82.0 (-3.2) |
| 2003.01 | 144.0 | 79.7 | 80.9 (-1.1) |
| 2003.02 | 124.5 | 46.0 | 78.5 (-2.4) |
| 2003.03 | 131.4 | 61.1 | 74.1 (-4.4) |
| 2003.04 | 126.4 | 60.0 | (69.6 predicted, -4.5) |
| 2003.05 | 115.7 | 55.2 | (65.3 predicted, -4.3) |
| 2003.06 | 129.3 | 77.4 | (61.5 predicted, -3.8) |
| 2003.07 | 127.7 | 85.0 | (58.0 predicted, -3.5) |
| 2003.08 | 122.1 | 72.7 | (55.0 predicted, -3.0) |
| 2003.09 | 112.2 | 48.8 | (53.0 predicted, -2.0) |
| 2003.10 | 108.8 (1) | 40.5 (2) | (50.3 predicted, -2.7) |
1) Running average based on the daily 20:00 UTC observed solar flux value at 2800 MHz.
2) Unofficial, accumulated value based on the Boulder (NOAA/SEC) sunspot number. The official international sunspot number is typically
30-50% less.
This report has been prepared by Jan Alvestad. It is based partly on my own observations and analysis, and partly on data from sources noted in solar links. All time references are to the UTC day. Comments and suggestions are always welcome.
| [DX-Listeners' Club] |