
Last major update issued on October 29, 2003 at 01:55 UTC.
Multiple minor updates posted during the day, the last one at 12:00 UTC.
[Solar and geomagnetic data - last month (updated daily)]
[Solar wind and electron fluence charts (updated daily)]
[Solar cycles 21-23 (last update October 4, 2003)]
[Solar cycles 1-20]
[Graphical comparison of cycles 21, 22 and 23 (last update October 4, 2003)]
[Graphical comparison of cycles 2, 10, 13, 17, 20 and 23 (last update October
4, 2003)]
[Historical solar and geomagnetic data charts 1954-2003 (last update October 15, 2003)]
[Archived reports (last update October 22, 2003)]
The geomagnetic field was unsettled to active on October 28. Solar wind speed ranged between 459 and 808 km/sec. A solar wind shock was observed at ACE at 01:30 UTC. This shock was likely related to the arrival of the halo CME observed after an X1 flare in region 10486 on October 26.
Solar flux measured at 20h UTC on 2.8 GHz was 274.4. The planetary A
index was 20 (STAR Ap - based on the mean of three hour interval ap indices: 20.6).
Three hour interval K indices: 34443434 (planetary), 24442434 (Boulder).
The background x-ray flux is at the class C3 level. A very strong proton storm is in progress. The above 100 MeV proton flux has so far reached the 180 pfu level, the above 50 MeV flux has peaked near the 1500 pfu level while the above 10 MeV proton flux is still increasing and has gone off scale well above 10000 pfu. The proton levels should increase further just prior to the arrival of the expected solar storm.
At midnight there were 10 spotted regions on the visible disk. Solar flare activity was very high. A total of 5 C, 5 M and 1 X class events was recorded during the day.
Region 10484 decayed fairly quickly losing penumbral area in all parts of the region. A major flare is still possible. Flares:
C6.7/1F at 00:59, C7.7/1F at 05:13 UTC.
Region 10486 was mostly unchanged. A thin corridor of negative polarity flux bisects the strong positive polarity area
in the central part of the region. Flaring has been observed in the eastern, central and western part of the region. Further major
flares are possible. Flares: C7.5 at 01:33, C8.7 at 08:39 UTC. Then an amazing sequence
of flares began: First an M1.3 event in the central part of region at 09:56, then an M2.3 flare at 10:09 in the eastern part of
region. A long duration major M8.4 event peaked at 10:48 UTC in the eastern part of the region. This event may have triggered a
massive X17.2 flare which began at 10:58 UTC and peaked at 11:10 UTC. The X17.2/4B flare was centered in the western part of the
region and is the second largest event recorded during solar cycle 23. Strong type II and IV radio sweeps were associated with the
X17 flare, as was a very bright, huge and extremely fast CME (speed estimated at well above 2000 km/sec). Additional flares: M3.2
at 14:53 and M2.0 at 16:13 UTC.
Region 10487 was mostly quiet and unchanged.
Region 10488 continued to develop rapidly and is now the second largest region on the visible disk, the leader umbra is
extremely large. The region could produce a major flare soon. Flare: C5.3 at 00:45 UTC.
Region 10489 added some small spots while the main spots lost some penumbral area.
Region 10490 was quiet and stable.
Region 10491 developed slowly and quietly.
Region 10492 developed slowly and was quiet.
New region 10493 emerged in the northeast quadrant on October 27 and was numbered by SEC the next day. The region developed
slowly on October 28. Region 10488 could soon merge with region 10493.
Spotted regions not numbered by NOAA/SEC:
[S293] A new region emerged in the southeast quadrant on October 28. Location at midnight: S23E45.
Comment added at 06:58 UTC on October 29: A huge solar storm has impacted the Earth, just over 19 hours after leaving the sun. This is probably the second fastest solar storm in historic times, only beaten by the perfect solar storm in the year 1859 which spent an estimated 17 hours in transit. Judging from the initial solar wind parameters at ACE the storm will cause extreme geomagnetic storming.
Comment added at 07:28 UTC: The solar storm reached ACE at 06h UTC and the Earth within the next 25 minutes. During the 06-07h UTC interval geomagnetic storming has ranged between K7 and K9 for all available magnetometers. The planetary A index for that single hour was 213 (Kp 8).
Comment added at 08:37 UTC: The planetary A index for the 06-08h UTC interval is 317 (Kp 9). The geomagnetic storm continues to intensify. There is a chance of power grid failures if the storm continues at its current level.
Comment added at 09:32 UTC: The planetary A index for the 06-09h UTC interval reached the maximum possible value, 400 (Kp 9). Please note that solar wind data from both ACE and SOHO is currently near useless. SOHO is either experiencing sensor problems or has had some kind of failure due to the combined destructive potential of the intense radiation storm and the extreme solar storm.
Comment added at 12:00 UTC: Region 10488 is still developing very quickly. Since midnight penumbral area growth has been impressive, particularly in the trailing spots. If this development continues until midnight, region 10488 could eclipse region 10486 as the largest region on the visible disk. The leading spot section of region 10493 has merged with region 10488 and has created another magnetic delta structure in this already complex region. A new region has emerged with a few small spots in the southeast quadrant, current location: S10E48. Region S293 has grown fairly quickly and has become a DAO region with an area of approximately 0080 millionths. Regions 10489 and 10492 have both become more complex with developing magnetic delta structures.
The geomagnetic storm continues but at a slightly lower level than during the initial three hours.
October 28: A full halo and extremely large CME was observed after the X17 flare in region 10486. The CME could reach Earth in less than 24 hours and could create a geomagnetic disturbance equaling or surpassing the great storm in 1989.
Coronal hole history (since late October 2002)
Compare today's report with the situation one solar rotation ago: 28
days ago 27 days ago 26 days ago
A recurrent coronal hole in the northern hemisphere (CH64) may have been in a geoeffective position on October 25-26. During the previous solar rotation this coronal hole did not cause a geomagnetic disturbance.
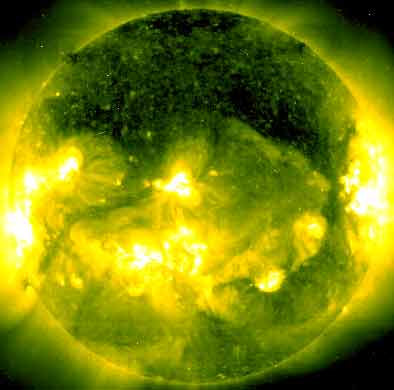
Processed SOHO/EIT 284 image at 07:06 UTC on October 28. The darkest areas on the solar disk are likely coronal holes.
The geomagnetic field is expected to be unsettled to active early on October 29, then reach the extremely severe storm level as a huge solar storm impacts Earth sometime between 06 and 16h UTC. Minor to severe storming is likely on October 30.
Long distance low frequency (below 2 MHz) propagation along east-west paths over high and upper middle latitudes is useless. Propagation along north-south paths is poor. [Trans Atlantic propagation conditions are currently monitored every night on 1470 kHz. Dominant stations none: heard only a very weak signal from Radio Cristal del Uruguay at times. Other frequencies were better, i.e. 930 kHz with R�dio Metropolitana, Fortaleza].
| Coronal holes (1) | Coronal mass ejections (2) | M and X class flares (3) |
1) Effects from a coronal hole could reach Earth within the next 5 days.
2) Material from a CME is likely to impact Earth within 96 hours.
3) There is a possibility of either M or X class flares within the next 48 hours.
Green: 0-20% probability, Yellow: 20-60% probability, Red: 60-100% probability.

Compare to the previous day's image.
Data for all numbered solar regions according to the Solar Region Summary provided by NOAA/SEC. Comments are my own, as is the STAR spot count (spots observed at or inside a few hours before midnight) and data for regions not numbered by SEC or where SEC has observed no spots.
| Solar region | Date numbered | SEC spot count |
STAR spot count |
Location at midnight | Area | Classification | Comment |
|---|---|---|---|---|---|---|---|
| 10482 | 2003.10.17 | N17W83 | plage | ||||
| 10483 | 2003.10.17 | S10W78 | plage | ||||
| 10484 | 2003.10.17 | 15 | 16 | N03W68 | 1240 | DKC |
gamma-delta area was 0850 at midnight |
| 10485 | 2003.10.21 | S07W44 | plage | ||||
| 10486 | 2003.10.22 | 55 | 83 | S17E04 | 2120 | FKC |
gamma-delta area was 2500 at midnight |
| 10487 | 2003.10.25 | 10 | 14 | N13E32 | 0170 | DAO | |
| 10488 | 2003.10.27 | 34 | 61 | N08W04 | 0800 | DKC |
beta-gamma-delta classification was EKC at midnight, area 1400 |
| 10489 | 2003.10.27 | 7 | 16 | S11W08 | 0020 | CRO |
classification was DSO at midnight, area 0060 |
| 10490 | 2003.10.27 | 1 | 2 | S11E11 | 0030 | HRX |
classification was HSX at midnight |
| 10491 | 2003.10.27 | 6 | 12 | S07W05 | 0050 | DAO |
area was 0090 at midnight |
| 10492 | 2003.10.27 | 10 | 19 | S23W34 | 0080 | DSO |
area was 0100 at midnight |
| 10493 | 2003.10.28 | 2 | 13 | N09E04 | 0010 | BXO |
formerly region S292 classification was DRO at midnight, area 0030 |
| S285 | emerged on 2003.10.23 |
N04W87 | plage | ||||
| S293 | emerged on 2003.10.28 |
5 | S23E45 | 0020 | CRO | ||
| Total spot count: | 140 | 241 | |||||
| SSN: | 230 | 341 | |||||
| Month | Average solar flux at Earth |
International sunspot number | Smoothed sunspot number |
|---|---|---|---|
| 2000.04 | 184.2 | 125.5 | 120.8 cycle 23 sunspot max. |
| 2000.07 | 202.3 | 170.1 | 119.8 |
| 2001.12 | 235.1 | 132.2 | 114.6 (-0.9) |
| 2002.09 | 175.8 | 109.6 | 94.6 (-4.1) |
| 2002.10 | 167.0 | 97.5 | 90.5 (-4.1) |
| 2002.11 | 168.7 | 95.5 | 85.2 (-5.3) |
| 2002.12 | 157.2 | 80.8 | 82.0 (-3.2) |
| 2003.01 | 144.0 | 79.7 | 80.9 (-1.1) |
| 2003.02 | 124.5 | 46.0 | 78.5 (-2.4) |
| 2003.03 | 131.4 | 61.1 | 74.1 (-4.4) |
| 2003.04 | 126.4 | 60.0 | (69.6 predicted, -4.5) |
| 2003.05 | 115.7 | 55.2 | (65.3 predicted, -4.3) |
| 2003.06 | 129.3 | 77.4 | (61.5 predicted, -3.8) |
| 2003.07 | 127.7 | 85.0 | (58.0 predicted, -3.5) |
| 2003.08 | 122.1 | 72.7 | (55.0 predicted, -3.0) |
| 2003.09 | 112.2 | 48.8 | (53.0 predicted, -2.0) |
| 2003.10 | 138.9 (1) | 90.6 (2) | (50.3 predicted, -2.7) |
1) Running average based on the daily 20:00 UTC observed solar flux value at 2800 MHz.
2) Unofficial, accumulated value based on the Boulder (NOAA/SEC) sunspot number. The official international sunspot number is typically
30-50% less.
This report has been prepared by Jan Alvestad. It is based partly on my own observations and analysis, and partly on data from sources noted in solar links. All time references are to the UTC day. Comments and suggestions are always welcome.
| [DX-Listeners' Club] |