
Last update issued on September 16, 2003 at 03:20 UTC.
[Solar and geomagnetic data - last month (updated daily)]
[Solar wind and electron fluence charts (updated daily)]
[Solar cycles 21-23 (last update September 1, 2003)]
[Solar cycles 1-20]
[Graphical comparison of cycles 21, 22 and 23 (last update September 1, 2003)]
[Graphical comparison of cycles 2, 10, 13, 17, 20 and 23 (last update September
1, 2003)]
[Historical solar and geomagnetic data charts 1954-2003 (last update July 23, 2003)]
[Archived reports (last update September 8, 2003)]
The geomagnetic field was quiet to unsettled on September 15. Solar wind speed ranged between 347 and 383 km/sec. A disturbance arrived at ACE at approximately 18h UTC. The most likely source of the disturbance is a CME observed early on September 12.
Solar flux measured at 20h UTC on 2.8 GHz was 97.3. The planetary A
index was 6 (STAR Ap - based on the mean of three hour interval ap indices: 7.9).
Three hour interval K indices: 21122223 (planetary), 21002032 (Boulder).
The background x-ray flux is at the class B4 level.
At midnight there were 5 spotted regions on the visible disk. Solar flare activity was low. A total of 6 C class events was recorded during the day. Spotless region 10458 was the source of a C1.5 flare at 16:40 UTC.
Region 10456 rotated out of view at the southwest limb. Flares: C1.9/1F at 01:01, C1.0 at
05:01, C2.9 at 14:50 and C1.0 at 22:14 UTC.
Region 10457 reemerged with a few spots and will rotate out of view of the southwest limb late today.
Region 10459 developed slowly and was mostly quiet. Flare: C1.5 at 23:01 UTC.
New region 10460 rotated into view at the northeast limb.
Spotted region not numbered by NOAA/SEC:
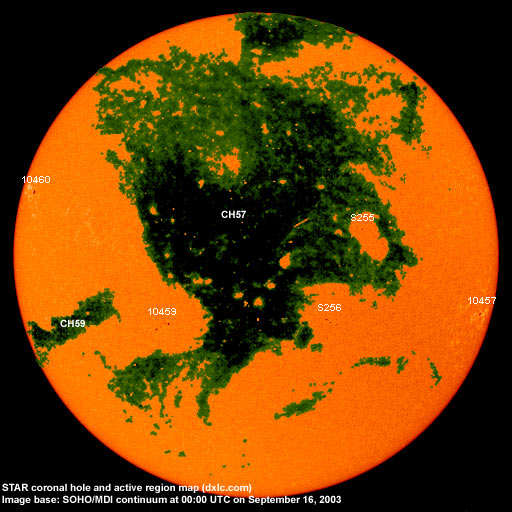
[S255] This region emerged in the northwest quadrant on September 14 and decayed slowly on September 15. Location at midnight:
N13W25.
[S256] A new region emerged in the southwest quadrant on September 15. Location at midnight: S08W17.
September 13-15: No potentially geoeffective CMEs observed.
Coronal hole history (since late October 2002)
Compare today's report with the situation one solar rotation ago: 28
days ago 27 days ago 26 days ago
Small coronal holes (CH56 and CH58) near the equator were in geoeffective positions on September 13 and appeared to close on September 14. A large recurrent trans equatorial coronal hole (CH57) will rotate into a geoeffective position on September 14-17.
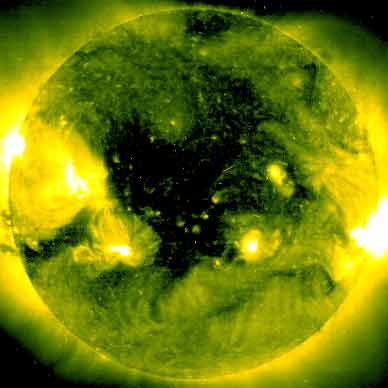
Processed SOHO/EIT 284 image from 01:06 UTC on September 16. The darkest areas on the solar disk are likely coronal holes.
The geomagnetic field is expected to be unsettled to minor storm until September 20 with a possibility of occasional major storm intervals on September 17 and 18 when the most intense part of a high speed stream from coronal hole CH57 will dominate the solar wind.
Long distance low frequency (below 2 MHz) propagation along east-west paths over high and upper middle latitudes is poor. Propagation along north-south paths is fair. [Trans Atlantic propagation conditions are currently monitored every night on 1470 kHz. Dominant station tonight: Radio Vibraci�n (Venezuela) except from 01:30 to 02:30 UTC when all northern signals disappeared and Cadena Peruana de Noticias cam through with a rather strong signal].
| Coronal holes (1) | Coronal mass ejections (2) | M and X class flares (3) |
1) Effects from a coronal hole could reach Earth within the next 5 days.
2) Material from a CME is likely to impact Earth within 96 hours.
3) There is a possibility of either M or X class flares within the next 48 hours.
Green: 0-20% probability, Yellow: 20-60% probability, Red: 60-100% probability.
Compare to the previous day's image.
Data for all numbered solar regions according to the Solar Region Summary provided by NOAA/SEC. Comments are my own, as is the STAR spot count (spots observed at or inside a few hours before midnight) and data for regions not numbered by SEC or where SEC has observed no spots.
| Solar region | Date numbered | SEC spot count |
STAR spot count |
Location at midnight | Area | Classification | Comment |
|---|---|---|---|---|---|---|---|
| 10455 | 2003.09.06 | S20W80 | plage | ||||
| 10456 | 2003.09.08 | 10 | S08W88 | 0110 | CSO | rotated out of view | |
| 10457 | 2003.09.09 | 1 | 3 | S12W69 | 0020 | HRX |
classification was HAX at midnight, area 0030 |
| 10458 | 2003.09.13 | 2 | S08W60 | 0010 | AXX | spotless | |
| 10459 | 2003.09.14 | 4 | 11 | S11E24 | 0020 | DSO | |
| 10460 | 2003.09.15 | 1 | 1 | N16E75 | 0040 | HSX | |
| S255 | emerged on 2003.09.14 |
2 | N13W25 | 0010 | BXO | ||
| S256 | emerged on 2003.09.15 |
5 | S08W17 | 0010 | CRO | ||
| Total spot count: | 18 | 22 | |||||
| SSN: | 68 | 72 | |||||
| Month | Average solar flux at Earth |
International sunspot number | Smoothed sunspot number |
|---|---|---|---|
| 2000.04 | 184.2 | 125.5 | 120.8 cycle 23 sunspot max. |
| 2000.07 | 202.3 | 170.1 | 119.8 |
| 2001.12 | 235.1 | 132.2 | 114.6 (-0.9) |
| 2002.07 | 173.5 | 99.6 | 102.7 (-3.5) |
| 2002.08 | 183.6 | 116.4 | 98.7 (-4.0) |
| 2002.09 | 175.8 | 109.6 | 94.6 (-4.1) |
| 2002.10 | 167.0 | 97.5 | 90.5 (-4.1) |
| 2002.11 | 168.7 | 95.5 | 85.2 (-5.3) |
| 2002.12 | 157.2 | 80.8 | 82.0 (-3.2) |
| 2003.01 | 144.0 | 79.7 | 81.0 (-1.0) |
| 2003.02 | 124.5 | 46.0 | 78.5 (-2.5) |
| 2003.03 | 131.4 | 61.1 | (74.2 predicted, -4.3) |
| 2003.04 | 126.4 | 60.0 | (69.3 predicted, -4.9) |
| 2003.05 | 115.7 | 55.2 | (64.4 predicted, -4.9) |
| 2003.06 | 129.3 | 77.4 | (60.4 predicted, -4.0) |
| 2003.07 | 127.7 | 85.0 | (56.9 predicted, -3.5) |
| 2003.08 | 122.1 | 72.7 | (53.9 predicted, -3.0) |
| 2003.09 | 102.0 (1) | 29.8 (2) | (51.9 predicted, -2.0) |
1) Running average based on the daily 20:00 UTC observed solar flux value at 2800 MHz.
2) Unofficial, accumulated value based on the Boulder (NOAA/SEC) sunspot number. The official international sunspot number is typically
30-50% less.
This report has been prepared by Jan Alvestad. It is based partly on my own observations and analysis, and partly on data from sources noted in solar links. All time references are to the UTC day. Comments and suggestions are always welcome.
| [DX-Listeners' Club] |