
Last major update issued on May 13, 2004 at 03:30 UTC.
[Solar and geomagnetic data - last month (updated daily)]
[Solar wind and electron fluence charts (updated daily)]
[Solar cycles 21-23 (last update May 3, 2004)]
[Solar cycles 1-20]
[Graphical comparison of cycles 21, 22 and 23 (last update May 3, 2004)]
[Graphical comparison of cycles 2, 10, 13, 17, 20 and 23 (last update May 3, 2004)]
[Historical solar and geomagnetic data charts 1954-2004 (last update April 28,
2004)]
[Archived reports (last update May 8, 2004)]
The geomagnetic field was quiet to active on May 12. Solar wind speed ranged between 378 and 437 km/sec.
Solar flux measured at 20h UTC on 2.8 GHz was 98.8. The planetary A
index was 11 (STAR Ap - based on the mean of three hour interval ap indices: 12.4).
Three hour interval K indices: 34222232 (planetary), 44321232 (Boulder).
The background x-ray flux is at the class B1-B2 level.
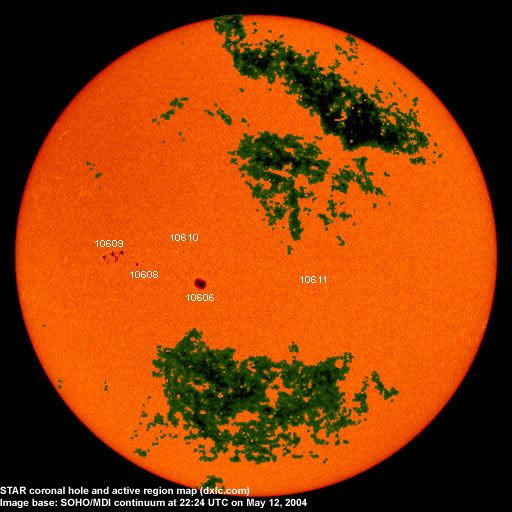
At midnight there were 5 spotted regions on the visible disk. The solar flare activity level was low. A single C class event was recorded during the day.
Region 10606 was quiet and stable.
Region 10608 decayed slowly and quietly.
Region 10609 developed quickly during the latter half of the day. A magnetic delta structure formed near the center of the
region. A minor M class flare is possible if development continues at the current rate. Flare:
C1.3 at 15:43 UTC.
New region 10610 emerged in the southeast quadrant near the solar equator. This region was first noted on May 11 when a few
spots emerged and then disappeared before midnight. The region decayed again late on May 12 and could soon become spotless again.
New region 10611 emerged on May 11 in the southwest quadrant and was numbered the next day by SEC. The region decayed on
May 12 and could soon become spotless.
May 11-12: No fully or partly Earth directed CME observed.
May 10: A slow partial halo CME was observed in LASCO C3 following a filament eruption in the southwest quadrant. This
eruption began at 03:36 UTC as observed in EIT images. The CME could reach Earth on May 13 and cause unsettled to active
conditions.
Coronal hole history (since late October 2002)
Compare today's report with the situation one solar rotation ago: 28
days ago 27 days ago 26 days ago
A coronal hole in the northern hemisphere is probably located too far to the north to have been geoeffective.

Processed SOHO/EIT 284 image at 19:05 UTC on May 12. The darkest areas on the solar disk are likely coronal holes.
The geomagnetic field is expected to be quiet to active on May 13-14 and quiet to unsettled on May 15. A CME could arrive on May 13 and cause unsettled to active conditions.
| Coronal holes (1) | Coronal mass ejections (2) | M and X class flares (3) |
1) Effects from a coronal hole could reach Earth within the next 5 days. When the high speed stream has arrived
the color changes to green.
2) Material from a CME is likely to impact Earth within 96 hours.
3) There is a possibility of either M or X class flares within the next 48 hours.
Green: 0-20% probability, Yellow: 20-60% probability, Red: 60-100% probability.
Long distance low and medium frequency (below 2 MHz) propagation along east-west paths over high and upper middle latitudes is poor. Propagation along long distance north-south paths is fair to poor. Trans Atlantic propagation conditions are monitored every night on 1470 kHz. Dominant stations tonight: Radio Vibraci�n and CPN Radio (Per�). WWZN Boston on 1510 kHz was the only USA station heard and had a weak signal. Several Newfoundland stations noted (560, 590, 620, 740, 750 and 930 kHz).
Compare to the previous day's image.
Data for all numbered solar regions according to the Solar Region Summary provided by NOAA/SEC. Comments are my own, as is the STAR spot count (spots observed at or inside a few hours before midnight) and data for regions not numbered by SEC or where SEC has observed no spots. SEC active region numbers in the table below and in the active region map above are the historic SEC/USAF numbers.
| Active region | Date numbered | SEC spot count |
STAR spot count |
Location at midnight | Area | Classification | Comment |
|---|---|---|---|---|---|---|---|
| 10604 | 2004.05.03 | S18W67 | plage | ||||
| 10606 | 2004.05.07 | 6 | 2 | S10E13 | 0190 | HAX | |
| 10607 | 2004.05.09 | S11W39 | plage | ||||
| 10608 | 2004.05.09 | 4 | 3 | S04E27 | 0030 | CAO |
classification was CSO at midnight |
| 10609 | 2004.05.10 | 15 | 19 | S04E41 | 0040 | DRO |
beta-gamma-delta classification was DAI at midnight, area 0110 |
| 10610 | 2004.05.12 | 6 | 1 | S02E19 | 0020 | BXO |
classification was AXX at midnight, area 0000 |
| 10611 | 2004.05.12 | 2 | 1 | S12W14 | 0020 | CSO |
formerly region S401 classification was AXX at midnight, area 0000 |
| Total spot count: | 33 | 26 | |||||
| SSN: | 83 | 76 | |||||
| Month | Average solar flux at Earth |
International sunspot number | Smoothed sunspot number |
|---|---|---|---|
| 2000.04 | 184.2 | 125.5 | 120.8 cycle 23 sunspot max. |
| 2000.07 | 202.3 | 170.1 | 119.8 |
| 2001.12 | 235.1 | 132.2 | 114.6 (-0.9) |
| 2003.04 | 126.4 | 60.0 | 70.1 (-3.9) |
| 2003.05 | 115.7 | 55.2 | 67.6 (-2.5) |
| 2003.06 | 129.3 | 77.4 | 65.0 (-2.6) |
| 2003.07 | 127.7 | 83.3 | 61.8 (-3.2) |
| 2003.08 | 122.1 | 72.7 | 60.0 (-1.8) |
| 2003.09 | 112.2 | 48.7 | 59.5 (-0.5) |
| 2003.10 | 151.7 | 65.5 | 58.1 (-1.4) |
| 2003.11 | 140.8 | 67.3 | (56.5 predicted, -1.6) |
| 2003.12 | 114.9 | 46.5 | (53.5 predicted, -3.0) |
| 2004.01 | 114.1 | 37.2 | (49.1 predicted, -4.4) |
| 2004.02 | 107.0 | 46.0 | (44.8 predicted, -4.3) |
| 2004.03 | 112.0 | 48.9 | (42.1 predicted, -2.7) |
| 2004.04 | 101.2 | 39.3 | (40.0 predicted, -2.1) |
| 2004.05 | 91.1 (1) | 19.6 (2) | (36.8 predicted, -3.2) |
1) Running average based on the daily 20:00 UTC observed solar flux value at 2800 MHz.
2) Unofficial, accumulated value based on the Boulder (NOAA/SEC) sunspot number. The official international sunspot number is typically
30-50% less.
This report has been prepared by Jan Alvestad. It is based partly on my own observations and analysis, and partly on data from some of these solar data sources. All time references are to the UTC day. Comments and suggestions are always welcome.
| [DX-Listeners' Club] |