
Last major update issued on May 19, 2004 at 04:05 UTC.
[Solar and geomagnetic data - last month (updated daily)]
[Solar wind and electron fluence charts (updated daily)]
[Solar cycles 21-23 (last update May 3, 2004)]
[Solar cycles 1-20]
[Graphical comparison of cycles 21, 22 and 23 (last update May 3, 2004)]
[Graphical comparison of cycles 2, 10, 13, 17, 20 and 23 (last update May 3, 2004)]
[Historical solar and geomagnetic data charts 1954-2004 (last update April 28,
2004)]
[Archived reports (last update May 18, 2004)]
The geomagnetic field was quiet on May 18. Solar wind speed ranged between 284 and 343 km/sec.
Solar flux measured at 20h UTC on 2.8 GHz was 107.8. The planetary A
index was 4 (STAR Ap - based on the mean of three hour interval ap indices: 5.6).
Three hour interval K indices: 11122111 (planetary), 21223331 (Boulder).
The background x-ray flux is at the class B1-B2 level.
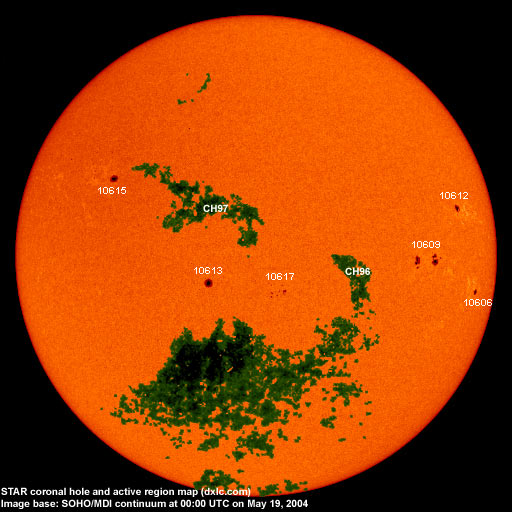
At midnight there were 6 spotted regions on the visible disk. The solar flare activity level was low. A total of 3 C class events was recorded during the day.
Region 10606 decayed slowly and quietly.
Region 10609 decayed further with loss of penumbral area and the leading penumbra splitting into two. A positive
polarity spot emerged just ahead of the leading negative polarity penumbra.
Region 10612 decayed further and lost all leading spots. Flare: C2.6 at 02:09 UTC.
Region 10613 was quiet and stable.
Region 10615 added some small trailing spots and could produce further C flares. Flares:
C3.2 at 08:27 and C1.6 at 16:02 UTC.
Region 10617 decayed in some parts of the region while slow development was observed in other parts. The number of spots
increased while penumbral area was less compared to one day earlier.
May 16-18: No fully or partly Earth directed CME observed.
Coronal hole history (since late October 2002)
Compare today's report with the situation one solar rotation ago: 28
days ago 27 days ago 26 days ago
A small, recurrent coronal hole (CH96) in the southern hemisphere was in a geoeffective position on May 17. A recurrent, poorly defined coronal hole (CH97) in the northern hemisphere will be in a geoeffective position on May 19-20.

Processed SOHO/EIT 284 image at 01:05 UTC on May 19. The darkest areas on the solar disk are likely coronal holes.
The geomagnetic field is expected to be quiet to unsettled on May 19 and 21. Quiet to active is likely on May 20 due to effects from a weak coronal hole stream. Another weak coronal hole flow could arrive on May 22 and cause some unsettled to active intervals that and the next day.
| Coronal holes (1) | Coronal mass ejections (2) | M and X class flares (3) |
1) Effects from a coronal hole could reach Earth within the next 5 days. When the high speed stream has arrived
the color changes to green.
2) Material from a CME is likely to impact Earth within 96 hours.
3) There is a possibility of either M or X class flares within the next 48 hours.
Green: 0-20% probability, Yellow: 20-60% probability, Red: 60-100% probability.
Long distance low and medium frequency (below 2 MHz) propagation along east-west paths over high and upper middle latitudes is fair to poor. Propagation along long distance north-south paths is fair. Trans Atlantic propagation conditions are monitored every night on 1470 kHz. Dominant station tonight: none, several stations were noted including Radio Vibraci�n (Venezuela), Radio Cristal del Uruguay and CPN Radio (Per�). Several North American stations were noted with mostly weak signals on other frequencies, a.o. WJAE on 1440 kHz was heard at the same time as the Rio de Janeiro station.
Compare to the previous day's image.
Data for all numbered solar regions according to the Solar Region Summary provided by NOAA/SEC. Comments are my own, as is the STAR spot count (spots observed at or inside a few hours before midnight) and data for regions not numbered by SEC or where SEC has observed no spots. SEC active region numbers in the table below and in the active region map above are the historic SEC/USAF numbers.
| Active region | Date numbered | SEC spot count |
STAR spot count |
Location at midnight | Area | Classification | Comment |
|---|---|---|---|---|---|---|---|
| 10606 | 2004.05.07 | 3 | 2 | S10W67 | 0080 | CAO |
classification was HAX at midnight, area 0040 |
| 10608 | 2004.05.09 | S04W52 | plage | ||||
| 10609 | 2004.05.10 | 13 | 17 | S03W46 | 0270 | DAI |
classification was DAO at midnight, area 0150 |
| 10610 | 2004.05.12 | S01W63 | plage | ||||
| 10612 | 2004.05.13 | 1 | 3 | N10W59 | 0100 | HAX |
area was 0060 at midnight |
| 10613 | 2004.05.13 | 2 | 2 | S09E12 | 0110 | HKX |
classification was HSX at midnight, area 0100 (HKX classification indicates asymmetrical penumbra and area at least 0250 mills) |
| 10615 | 2004.05.16 | 3 | 5 | N17E38 | 0120 | HHX |
classification was CAO at midnight, area 0090 (see note above for region 10613, HHX classification indicates area of at least 0250 mills and a symmetrical penumbra) |
| 10616 | 2004.05.16 | N07E43 | plage | ||||
| 10617 | 2004.05.17 | 9 | 14 | S11W04 | 0030 | DSO |
classification was CAI at midnight |
| S402 | emerged on 2004.05.13 |
N02W67 | plage | ||||
| Total spot count: | 31 | 43 | |||||
| SSN: | 91 | 103 | |||||
| Month | Average solar flux at Earth |
International sunspot number | Smoothed sunspot number |
|---|---|---|---|
| 2000.04 | 184.2 | 125.5 | 120.8 cycle 23 sunspot max. |
| 2000.07 | 202.3 | 170.1 | 119.8 |
| 2001.12 | 235.1 | 132.2 | 114.6 (-0.9) |
| 2003.04 | 126.4 | 60.0 | 70.1 (-3.9) |
| 2003.05 | 115.7 | 55.2 | 67.6 (-2.5) |
| 2003.06 | 129.3 | 77.4 | 65.0 (-2.6) |
| 2003.07 | 127.7 | 83.3 | 61.8 (-3.2) |
| 2003.08 | 122.1 | 72.7 | 60.0 (-1.8) |
| 2003.09 | 112.2 | 48.7 | 59.5 (-0.5) |
| 2003.10 | 151.7 | 65.5 | 58.1 (-1.4) |
| 2003.11 | 140.8 | 67.3 | (56.5 predicted, -1.6) |
| 2003.12 | 114.9 | 46.5 | (53.5 predicted, -3.0) |
| 2004.01 | 114.1 | 37.2 | (49.1 predicted, -4.4) |
| 2004.02 | 107.0 | 46.0 | (44.8 predicted, -4.3) |
| 2004.03 | 112.0 | 48.9 | (42.1 predicted, -2.7) |
| 2004.04 | 101.2 | 39.3 | (40.0 predicted, -2.1) |
| 2004.05 | 97.6 (1) | 42.5 (2) | (36.8 predicted, -3.2) |
1) Running average based on the daily 20:00 UTC observed solar flux value at 2800 MHz.
2) Unofficial, accumulated value based on the Boulder (NOAA/SEC) sunspot number. The official international sunspot number is typically
30-50% less.
This report has been prepared by Jan Alvestad. It is based partly on my own observations and analysis, and partly on data from some of these solar data sources. All time references are to the UTC day. Comments and suggestions are always welcome.
| [DX-Listeners' Club] |