
Last major update issued on May 20, 2004 at 05:10 UTC.
[Solar and geomagnetic data - last month (updated daily)]
[Solar wind and electron fluence charts (updated daily)]
[Solar cycles 21-23 (last update May 3, 2004)]
[Solar cycles 1-20]
[Graphical comparison of cycles 21, 22 and 23 (last update May 3, 2004)]
[Graphical comparison of cycles 2, 10, 13, 17, 20 and 23 (last update May 3, 2004)]
[Historical solar and geomagnetic data charts 1954-2004 (last update April 28,
2004)]
[Archived reports (last update May 18, 2004)]
The geomagnetic field was quiet to unsettled on May 19. Solar wind speed ranged between 302 and 374 km/sec. A weak disturbance began after noon. After 22h UTC solar wind speed increased slowly, perhaps due to the arrival of a fairly low speed stream from coronal hole CH96.
Solar flux measured at 20h UTC on 2.8 GHz was 108.8. The planetary A
index was 6 (STAR Ap - based on the mean of three hour interval ap indices: 8.3).
Three hour interval K indices: 12113222 (planetary), 13133433 (Boulder).
The background x-ray flux is at the class B2-B3 level.
At midnight there were 7 spotted regions on the visible disk. The solar flare activity level was low. A total of 2 C class events was recorded during the day. A fairly active region is at the southeast limb near region S405 and should rotate into view today. This region produced a C1.1 flare at 18:47 and a C2.2 flare at 19:51 UTC.
Region 10606 decayed slowly and quietly, the region is about to rotate over the southwest limb.
Region 10609 decayed slowly and quietly.
Region 10612 decayed quickly and could become spotless before rotating over the northwest limb late today and early
tomorrow.
Region 10613 was quiet and stable.
Region 10615 decayed slightly as the small trailing spots disappeared.
Region 10617 developed during the first half of the day, then began to decay slowly.
Spotted regions not numbered by NOAA/SEC:
[S405] This region rotated into view late on May 19 at the southeast limb. The magnetogram is interesting (with
positive polarity in the north and a small negative polarity area in the south), however, only a few small spots are visible at
this time. Location at midnight: S09E80.
May 17-19: No fully or partly Earth directed CME observed.
Coronal hole history (since late October 2002)
Compare today's report with the situation one solar rotation ago: 28
days ago 27 days ago 26 days ago
A small, recurrent coronal hole (CH96) in the southern hemisphere was in a geoeffective position on May 17. A recurrent, poorly defined coronal hole (CH97) in the northern hemisphere will be in a geoeffective position on May 19-20.
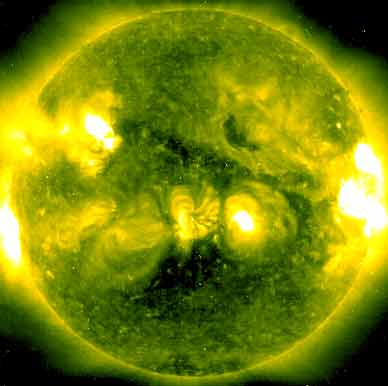
Processed SOHO/EIT 284 image at 19:05 UTC on May 19. The darkest areas on the solar disk are likely coronal holes.
The geomagnetic field is expected to be quiet to active on May 20 due to effects from a weak coronal hole stream. Another weak coronal hole flow could arrive on May 22 and cause some unsettled to active intervals that day and the next day.
| Coronal holes (1) | Coronal mass ejections (2) | M and X class flares (3) |
1) Effects from a coronal hole could reach Earth within the next 5 days. When the high speed stream has arrived
the color changes to green.
2) Material from a CME is likely to impact Earth within 96 hours.
3) There is a possibility of either M or X class flares within the next 48 hours.
Green: 0-20% probability, Yellow: 20-60% probability, Red: 60-100% probability.
Long distance low and medium frequency (below 2 MHz) propagation along east-west paths over high and upper middle latitudes is poor. Propagation along long distance north-south paths is fair to good. Trans Atlantic propagation conditions are monitored every night on 1470 kHz. Dominant station tonight: Radio Vibraci�n (Venezuela) with a strong signal, Radio Cristal del Uruguay and CPN Radio (Per�) were heard as well. At local sunrise several stations from Venezuela had good signals, a.o. stations on 1420, 1430 and 1500 kHz. WWZN Boston on 1510 kHz had a fairly strong signal at times.
Compare to the previous day's image.
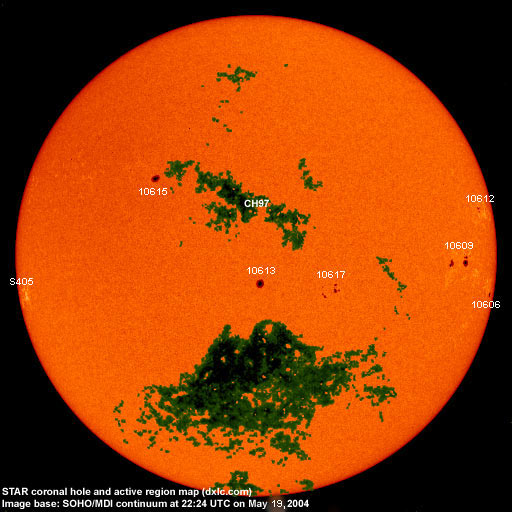
Data for all numbered solar regions according to the Solar Region Summary provided by NOAA/SEC. Comments are my own, as is the STAR spot count (spots observed at or inside a few hours before midnight) and data for regions not numbered by SEC or where SEC has observed no spots. SEC active region numbers in the table below and in the active region map above are the historic SEC/USAF numbers.
| Active region | Date numbered | SEC spot count |
STAR spot count |
Location at midnight | Area | Classification | Comment |
|---|---|---|---|---|---|---|---|
| 10606 | 2004.05.07 | 1 | 1 | S09W80 | 0050 | HAX |
classification was HSX at midnight, area 0030 |
| 10608 | 2004.05.09 | S04W65 | plage | ||||
| 10609 | 2004.05.10 | 10 | 15 | S04W58 | 0200 | DKO |
classification was DAO at midnight, area 0110 (DKO classification not possible) |
| 10610 | 2004.05.12 | S01W76 | plage | ||||
| 10612 | 2004.05.13 | 3 | 3 | N11W70 | 0050 | CAO |
classification was HAX at midnight, area 0030 |
| 10613 | 2004.05.13 | 1 | 1 | S09W01 | 0090 | HKX |
classification was HSX at midnight (HKX classification indicates asymmetrical penumbra and area at least 0250 mills) |
| 10615 | 2004.05.16 | 2 | 4 | N16E26 | 0090 | HKX |
(see note above for region 10613, HKX not possible in this case) |
| 10616 | 2004.05.16 | N07E30 | plage | ||||
| 10617 | 2004.05.17 | 10 | 16 | S10W19 | 0050 | DAO | |
| S402 | emerged on 2004.05.13 |
N02W80 | plage | ||||
| S405 | emerged on 2004.05.19 |
4 | S09E80 | 0020 | BXO | ||
| Total spot count: | 27 | 44 | |||||
| SSN: | 87 | 114 | |||||
| Month | Average solar flux at Earth |
International sunspot number | Smoothed sunspot number |
|---|---|---|---|
| 2000.04 | 184.2 | 125.5 | 120.8 cycle 23 sunspot max. |
| 2000.07 | 202.3 | 170.1 | 119.8 |
| 2001.12 | 235.1 | 132.2 | 114.6 (-0.9) |
| 2003.04 | 126.4 | 60.0 | 70.1 (-3.9) |
| 2003.05 | 115.7 | 55.2 | 67.6 (-2.5) |
| 2003.06 | 129.3 | 77.4 | 65.0 (-2.6) |
| 2003.07 | 127.7 | 83.3 | 61.8 (-3.2) |
| 2003.08 | 122.1 | 72.7 | 60.0 (-1.8) |
| 2003.09 | 112.2 | 48.7 | 59.5 (-0.5) |
| 2003.10 | 151.7 | 65.5 | 58.1 (-1.4) |
| 2003.11 | 140.8 | 67.3 | (56.5 predicted, -1.6) |
| 2003.12 | 114.9 | 46.5 | (53.5 predicted, -3.0) |
| 2004.01 | 114.1 | 37.2 | (49.1 predicted, -4.4) |
| 2004.02 | 107.0 | 46.0 | (44.8 predicted, -4.3) |
| 2004.03 | 112.0 | 48.9 | (42.1 predicted, -2.7) |
| 2004.04 | 101.2 | 39.3 | (40.0 predicted, -2.1) |
| 2004.05 | 98.1 (1) | 45.3 (2) | (36.8 predicted, -3.2) |
1) Running average based on the daily 20:00 UTC observed solar flux value at 2800 MHz.
2) Unofficial, accumulated value based on the Boulder (NOAA/SEC) sunspot number. The official international sunspot number is typically
30-50% less.
This report has been prepared by Jan Alvestad. It is based partly on my own observations and analysis, and partly on data from some of these solar data sources. All time references are to the UTC day. Comments and suggestions are always welcome.
| [DX-Listeners' Club] |