
Last major update issued on September 14, 2004 at 03:30 UTC.
[Solar and geomagnetic data - last month (updated daily)]
[Solar wind and electron fluence charts (updated daily)]
[Solar cycles 21-23 (last update September 2, 2004)]
[Solar cycles 1-20]
[Graphical comparison of cycles 21, 22 and 23 (last update September 2, 2004)]
[Graphical comparison of cycles 2, 10, 13, 17, 20 and 23 (last update September
2, 2004)]
[Historical solar and geomagnetic data charts 1954-2004 (last update August 28,
2004)]
[Archived reports (last update September 11, 2004)]
The geomagnetic field was quiet to active on September 13. Solar wind speed ranged between 280 and 598 km/sec. A strong solar wind shock was observed at SOHO at 19:29 UTC, this was the arrival of the CME observed very early on September 12. The interplanetary magnetic field has been mostly northwards since the shock resulting in unsettled to active geomagnetic conditions. There is still a possibility that the IMF could swing strongly southwards, in which case minor to major storming is possible. The arrival of the solar storm was associated with a significant increase in proton levels. The above 10 MeV proton flux peaked near the 250 pfu level at midnight UTC.
Solar flux measured at 20h UTC on 2.8 GHz was 117.7. The planetary A
index was 8 (STAR Ap - based on the mean of three hour interval ap indices: 9.6).
Three hour interval K indices: 21012234 (planetary), 11011334 (Boulder).
The background x-ray flux is at the class B4 level.
At midnight there were 2 spotted regions on the visible disk. The solar flare activity level was low. A total of 3 C class events was recorded during the day.
Region 10669 rotated partly out of view at the southwest limb. Flare: C1.0 at
00:08 UTC.
Region 10672 developed moderately quickly. A new negative polarity area emerged in the middle of the main positive
polarity area further complicating the magnetic layout of the region. A major proton flare is possible. Flares:
C1.4 at 13:39 and C1.4 at 20:11 UTC.
September 11 and 13: No obviously Earth directed CMEs were observed.
September 12: A large full halo CME was associated with the M4.8 long duration event which began at 23:55 UTC on September
11 and peaked nearly one hour later.
Coronal hole history (since late October 2002)
Compare today's report with the situation one solar rotation ago: 28
days ago 27 days ago 26 days ago
A coronal hole (CH113) in the southern hemisphere was likely in a marginally geoeffective position on September 11-12.

Processed SOHO/EIT 284 image at 19:06 UTC on September 10. The darkest areas on the solar disk are likely coronal holes.
The geomagnetic field is expected to be unsettled to minor storm on September 14 and quiet to unsettled on September 15-16.
| Coronal holes (1) | Coronal mass ejections (2) | M and X class flares (3) |
1) Effects from a coronal hole could reach Earth within the next 5 days. When the high speed stream has arrived
the color changes to green.
2) Material from a CME is likely to impact Earth within 96 hours.
3) There is a possibility of either M or X class flares within the next 48 hours.
Green: 0-20% probability, Yellow: 20-60% probability, Red: 60-100% probability.
Long distance low and medium frequency (below 2 MHz) propagation along east-west paths over high and upper middle latitudes is poor. Propagation along long distance north-south paths is poor. Trans Atlantic propagation conditions are monitored every night on 1470 kHz. Dominant station tonight: Radio Vibraci�n (Venezuela). A few other stations from Venezuela were noted on other frequencies, all of them with poor signals. From the Caribbean WDHP 1620, Harbour Light on 1400 and the Puerto Rican stations on 1480 and 1600 had poor to fair signals. From North America the Newfoundland stations had the best signals (540, 560, 590, 620, 640, 710, 740 and 930 kHz) while WWZN 1510 and the Florida stations on 1660 and 1700 kHz had poor signals.
Local sunrise propagation on September 13 was excellent with Mexican stations noted on 6-7 frequencies. WLQV on 1500 kHz was better than the usually very dominant WTOP, generally propagation favored the inland stations over the east coast stations.
Compare to the previous day's image.
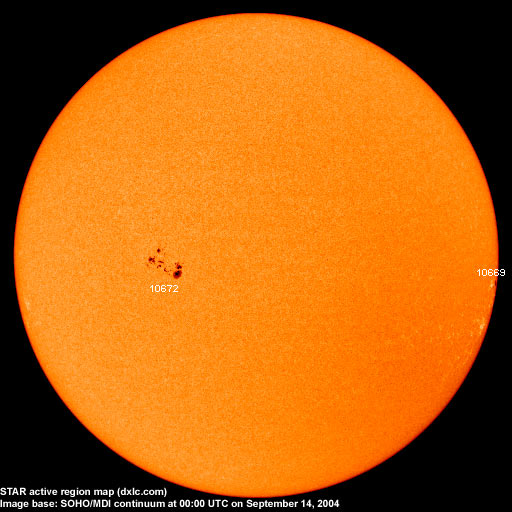
Data for all numbered solar regions according to the Solar Region Summary provided by NOAA/SEC. Comments are my own, as is the STAR spot count (spots observed at or inside a few hours before midnight) and data for regions not numbered by SEC or where SEC has observed no spots. SEC active region numbers in the table below and in the active region map above are the historic SEC/USAF numbers.
| Active region | Date numbered | SEC spot count |
STAR spot count |
Location at midnight | Area | Classification | Comment |
|---|---|---|---|---|---|---|---|
| 10667 | 2004.09.01 | 1 | S10W85 | 0180 | HAX | rotated out of view | |
| 10669 | 2004.09.05 | 2 | 1 | S04W81 | 0060 | HAX | |
| 10672 | 2004.09.09 | 32 | 48 | N04E22 | 0270 | DAO |
beta-gamma classification was DAI at midnight, area 0320 |
| S451 | emerged on 2004.09.08 |
S06W12 | plage | ||||
| Total spot count: | 35 | 49 | |||||
| SSN: | 65 | 69 | |||||
| Month | Average solar flux at Earth |
International sunspot number | Smoothed sunspot number |
|---|---|---|---|
| 2000.04 | 184.2 | 125.5 | 120.8 cycle 23 sunspot max. |
| 2000.07 | 202.3 | 170.1 | 119.8 |
| 2001.12 | 235.1 | 132.2 | 114.6 (-0.9) |
| 2003.07 | 127.7 | 83.3 | 61.8 (-3.2) |
| 2003.08 | 122.1 | 72.7 | 60.1 (-1.7) |
| 2003.09 | 112.2 | 48.7 | 59.6 (-0.5) |
| 2003.10 | 151.7 | 65.5 | 58.2 (-1.4) |
| 2003.11 | 140.8 | 67.3 | 56.8 (-1.4) |
| 2003.12 | 114.9 | 46.5 | 54.8 (-2.0) |
| 2004.01 | 114.1 | 37.7 | 52.0 (-2.8) |
| 2004.02 | 107.0 | 45.8 | 49.3 (-2.7) |
| 2004.03 | 112.0 | 49.1 | (47.0 predicted, -2.3) |
| 2004.04 | 101.2 | 39.3 | (44.8 predicted, -2.2) |
| 2004.05 | 99.8 | 41.5 | (41.5 predicted, -3.3) |
| 2004.06 | 97.4 | 43.2 | (38.6 predicted, -2.9) |
| 2004.07 | 119.1 | 51.0 | (36.8 predicted, -1.8) |
| 2004.08 | 109.6 | 40.9 | (35.4 predicted, -1.4) |
| 2004.09 | 111.0 (1) | 27.2 (2) | (34.2 predicted, -1.2) |
1) Running average based on the daily 20:00 UTC observed solar flux value at 2800 MHz.
2) Unofficial, accumulated value based on the Boulder (NOAA/SEC) sunspot number. The official international sunspot number is typically
30-50% less.
This report has been prepared by Jan Alvestad. It is based partly on my own observations and analysis, and partly on data from some of these solar data sources. All time references are to the UTC day. Comments and suggestions are always welcome.
| [DX-Listeners' Club] |