
Last major update issued on August 5, 2005 at 04:15 UTC.
[Solar and
geomagnetic data - last month (updated daily)]
[Solar wind and
electron fluence charts (updated daily)]
[Solar cycles 21-23
(last update August 2, 2005)]
[Solar cycles 1-20]
[Graphical comparison
of cycles 21, 22 and 23 (last update August 2, 2005)]
[Graphical
comparison of cycles 2, 10, 13, 17, 20 and 23 (last update August 2, 2005)]
[Historical solar and
geomagnetic data charts 1954-2004 (last update February 1, 2005)]
[Archived reports
(last update August 3, 2005)]
The geomagnetic field was quiet to active on August 4. Solar wind speed ranged between 361 and 461 (all day average 420) km/sec.
Solar flux measured at 20h UTC on 2.8 GHz was 106.1. The planetary
A
index was 14 (STAR Ap - based on the mean of three hour interval ap
indices: 14.0).
Three hour interval K indices: 33432223 (planetary), 32333313 (Boulder).
The background x-ray flux is at the class B2 level.
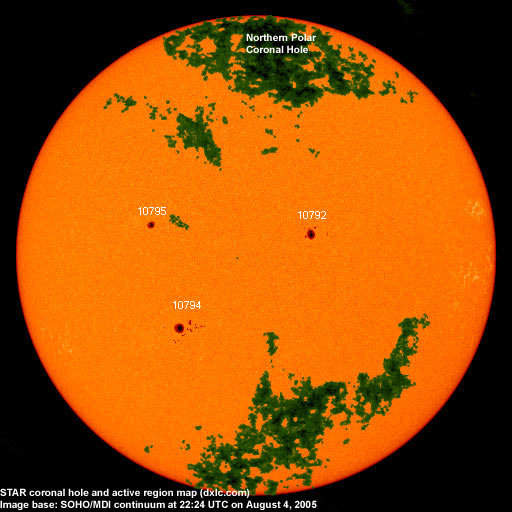
At midnight there were 3 spotted regions on the visible solar disk. The solar flare activity level was low. A total of 3 C class events was recorded during the day.
Region 10792 decayed further. The region has reversed polarities and could develop again. Flares:
C1.1 at 03:14 and C1.2 at 05:32 UTC.
Region 10794 developed slowly adding a few spots. A small magnetic delta structure has formed in the northernmost penumbra
ahead of the main penumbra. A minor M class flare is possible. Flare: long duration C8.4 event
peaking at 05:59 UTC.
Region 10795 was quiet and stable.
August 2-4: No obvious partly or fully Earth directed CMEs were observed.
Coronal hole
history (since late October 2002)
Compare today's report with the situation one solar rotation ago: 28
days ago 27 days ago 26
days ago
A small trans equatorial coronal hole (CH178) became less obvious on August 4 when it would have been in an Earth facing position. This was probably due to coronal outflow from nearby region 10796.

Processed SOHO/EIT 284 image at 19:06 UTC on August 4. The darkest areas on the solar disk are likely coronal holes.
The geomagnetic field is expected to be quiet to unsettled on August 5-7.
| Coronal holes (1) | Coronal mass ejections (2) | M and X class flares (3) |
1) Effects from a coronal hole could reach Earth
within the next 5 days. When the high speed stream has arrived
the color changes to green.
2) Material from a CME is likely to impact Earth within 96 hours.
3) There is a possibility of either M or X class flares within the next
48 hours.
Green: 0-20% probability, Yellow: 20-60% probability, Red: 60-100% probability.
Long distance low and medium frequency (below 2 MHz) propagation along east-west paths over high and upper middle latitudes is fair to poor. Propagation on long distance northeast-southwest paths is poor. Trans Atlantic propagation conditions are normally monitored every night on 1470 kHz. Dominant stations tonight: Radio Vibraci�n (Venezuela), Radio Cristal del Uruguay and CPN Radio (strong signal 02:15-03:15 UTC). Quite a few stations from North America were noted before LSR. While the strongest signal was from Radio Disney (New York) on 1560 kHz, several other stations in the Boston-New York area had fair signals. Most of the usual Newfoundland and Nova Scotia stations were audible.
Compare to the previous day's image.
Data for all numbered solar regions according to the Solar Region Summary provided by NOAA/SEC. Comments are my own, as is the STAR spot count (spots observed at or inside a few hours before midnight) and data for regions not numbered by SEC or where SEC has observed no spots. SEC active region numbers in the table below and in the active region map above are the historic SEC/USAF numbers.
| Active region | Date numbered | SEC spot count |
STAR spot count |
Location at midnight | Area | Classification | Comment |
|---|---|---|---|---|---|---|---|
| 10792 | 2005.07.28 | 18 | 14 | N11W14 | 0180 | DKI | classification was CAO at midnight, area 0140 |
| 10793 | 2005.07.29 | N13W68 | plage | ||||
| 10794 | 2005.07.31 | 29 | 27 | S11E19 | 0220 | DSI |
beta-gamma-delta area was 0160 at midnight |
| 10795 | 2005.07.31 | 8 | 3 | N13E27 | 0100 | CAO | classification was HAX at midnight |
| 10796 | 2005.08.03 | S07W08 | plage | ||||
| S575 | 2005.07.29 | N12W67 | plage | ||||
| S576 | 2005.07.30 | N01W65 | plage | ||||
| Total spot count: | 55 | 44 | |||||
| SSN: | 85 | 74 | |||||
| Month | Average solar flux at Earth |
International sunspot number | Smoothed sunspot number |
|---|---|---|---|
| 2000.04 | 184.2 | 125.5 | 120.8 cycle 23 sunspot max. |
| 2000.07 | 202.3 | 170.1 | 119.8 |
| 2001.12 | 235.1 | 132.2 | 114.6 (-0.9) |
| 2004.06 | 97.4 | 43.2 | 41.6 (-2.2) |
| 2004.07 | 119.1 | 51.1 | 40.2 (-1.4) |
| 2004.08 | 109.6 | 40.9 | 39.2 (-1.0) |
| 2004.09 | 103.1 | 27.7 | 37.5 (-1.7) |
| 2004.10 | 105.9 | 48.0 | 35.9 (-1.6) |
| 2004.11 | 113.2 | 43.5 | 35.3 (-0.6) |
| 2004.12 | 94.5 | 17.9 | 35.2 (-0.1) |
| 2005.01 | 102.2 | 31.3 | 34.6 (-0.6) |
| 2005.02 | 97.2 | 29.1 | (33.5 predicted, -1.1) |
| 2005.03 | 89.9 | 24.8 | (32.1 predicted, -1.4) |
| 2005.04 | 86.0 | 24.4 | (30.2 predicted, -1.9) |
| 2005.05 | 99.3 | 42.6 | (27.6 predicted, -2.6) |
| 2005.06 | 93.7 | 39.3 | (26.1 predicted, -1.5) |
| 2005.07 | 96.4 | 39.9 | (25.1 predicted, -1.0) |
| 2005.08 | 109.1 (1) | 12.9 (2) | (23.2 predicted, -1.9) |
1) Running average based on the daily 20:00 UTC observed solar flux
value at 2800 MHz.
2) Unofficial, accumulated value based on the Boulder (NOAA/SEC)
sunspot number. The official international sunspot number is typically
30-50% lower.
This report has been prepared by Jan Alvestad. It is based partly on my own observations and analysis, and partly on data from some of these solar data sources. All time references are to the UTC day. Comments and suggestions are always welcome.
| [DX-Listeners' Club] |