
Last major update issued on July 10, 2005 at 05:30 UTC.
[Solar and
geomagnetic data - last month (updated daily)]
[Solar wind and
electron fluence charts (updated daily)]
[Solar cycles 21-23
(last update July 2, 2005)]
[Solar cycles 1-20]
[Graphical comparison
of cycles 21, 22 and 23 (last update July 2, 2005)]
[Graphical
comparison of cycles 2, 10, 13, 17, 20 and 23 (last update July 2, 2005)]
[Historical solar and
geomagnetic data charts 1954-2004 (last update February 1, 2005)]
[Archived reports
(last update July 2, 2005)]
The geomagnetic field was unsettled to active on July 9. Solar wind speed ranged between 329 and 367 (all day average 347) km/sec, possibly under the influence of a low speed stream from CH174. A solar wind shock was observed at SOHO at 02:56 UTC on July 10, this was the arrival of one of the CMEs observed on July 7. Solar wind speed increased abruptly from 350 to 416 km/sec.
Solar flux measured at 20h UTC on 2.8 GHz was 106.6. The planetary
A
index was 19 (STAR Ap - based on the mean of three hour interval ap
indices: 19.0).
Three hour interval K indices: 33334434 (planetary), 33333423 (Boulder).
The background x-ray flux is at the class B2 level.
At midnight there were 4 spotted regions on the visible solar disk. The solar flare activity level was moderate. A total of 2 C and 1 M class events was recorded during the day.
Region 10783 decayed further and rotated partly out of view at the southwest limb.
Region 10786 decayed further losing penumbral area. There is still a chance of a minor M class
flare. Flares: long duration C2.1 event peaking at 10:27, C1.1 at 20:45, M2.8/1N at 22:06 UTC.
The M2 event was associated with a full halo CME and a minor increase in proton levels.
Region 10788 was quiet and stable.
Region 10789 was mostly unchanged and quiet.
July 9: The M2 event in region 10786 produced a full halo CME. This CME was first observed in LASCO C3 images at 23:18
UTC.
July 8: The C1 long duration event in region 10786 during the afternoon was apparently associated with (at least) a
very faint partial halo CME. This CME was observed in LASCO C3 images during the evening and early on July 9.
July 7: A filament eruption which started at approximately 11h UTC just south of region 10786 was the likely source of a
full halo CME observed in LASCO C3 images beginning at 14:42 UTC. Another full halo CME was observed in LASCO C3 images beginning
at 18:18 UTC. Its source was likely the M4.9 flare in region 10786. The CME was not very impressive.
Coronal hole
history (since late October 2002)
Compare today's report with the situation one solar rotation ago: 28
days ago 27 days ago 26
days ago
No obvious coronal holes are current in or near Earth facing positions.
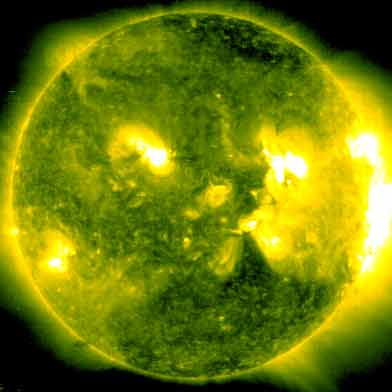
Processed SOHO/EIT 284 image at 01:06 UTC on July 10. The darkest areas on the solar disk are likely coronal holes.
The geomagnetic field is expected to be unsettled to minor storm on July 10 due to CME effects. Quiet to active is likely on July 11. The CME observed late on July 9 will probably reach Earth early on July 12 and cause unsettled to major storm conditions.
| Coronal holes (1) | Coronal mass ejections (2) | M and X class flares (3) |
1) Effects from a coronal hole could reach Earth
within the next 5 days. When the high speed stream has arrived
the color changes to green.
2) Material from a CME is likely to impact Earth within 96 hours.
3) There is a possibility of either M or X class flares within the next
48 hours.
Green: 0-20% probability, Yellow: 20-60% probability, Red: 60-100% probability.
Long distance low and medium frequency (below 2 MHz) propagation along east-west paths over high and upper middle latitudes is very poor. Propagation along long distance north-south paths is poor. Trans Atlantic propagation conditions are normally monitored every night on 1470 kHz. Dominant station tonight: Radio Cristal del Uruguay (audio until over 2 hours after LSR, carrier more than 2.5 hours after LSR). There were not that many other overseas stations audible, only the most common stations from Argentina, Uruguay and Brazil.
Compare to the previous day's image.
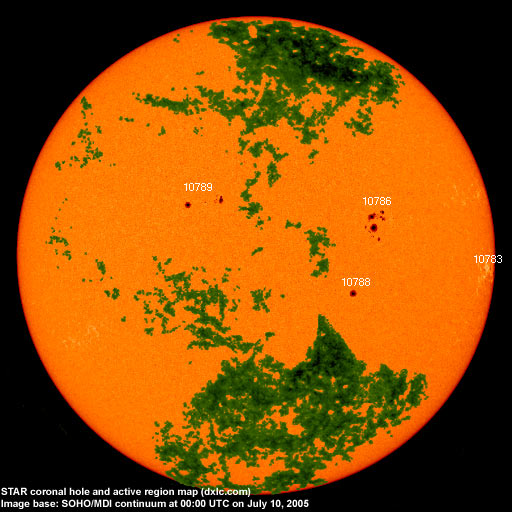
Data for all numbered solar regions according to the Solar Region Summary provided by NOAA/SEC. Comments are my own, as is the STAR spot count (spots observed at or inside a few hours before midnight) and data for regions not numbered by SEC or where SEC has observed no spots. SEC active region numbers in the table below and in the active region map above are the historic SEC/USAF numbers.
| Active region | Date numbered | SEC spot count |
STAR spot count |
Location at midnight | Area | Classification | Comment |
|---|---|---|---|---|---|---|---|
| 10781 | 2005.06.27 | N14W77 | plage | ||||
| 10783 | 2005.06.29 | 13 | 7 | S03W75 | 0230 | EKI | classification was CAO at midnight, area 0070 |
| 10784 | 2005.06.29 | N16W64 | plage | ||||
| 10786 | 2005.07.01 | 45 | 29 | N11W31 | 0310 | DKC |
beta-gamma classification was DAC at midnight |
| 10788 | 2005.07.02 | 2 | 1 | S06W23 | 0100 | HSX | |
| 10789 | 2005.07.03 | 26 | 11 | N18E15 | 0170 | ESI | classification was ESO at midnight |
| S567 | 2005.07.03 | S07W15 | plage | ||||
| Total spot count: | 86 | 48 | |||||
| SSN: | 126 | 88 | |||||
| Month | Average solar flux at Earth |
International sunspot number | Smoothed sunspot number |
|---|---|---|---|
| 2000.04 | 184.2 | 125.5 | 120.8 cycle 23 sunspot max. |
| 2000.07 | 202.3 | 170.1 | 119.8 |
| 2001.12 | 235.1 | 132.2 | 114.6 (-0.9) |
| 2004.05 | 99.8 | 41.5 | 43.8 (-1.7) |
| 2004.06 | 97.4 | 43.2 | 41.6 (-2.2) |
| 2004.07 | 119.1 | 51.1 | 40.2 (-1.4) |
| 2004.08 | 109.6 | 40.9 | 39.2 (-1.0) |
| 2004.09 | 103.1 | 27.7 | 37.5 (-1.7) |
| 2004.10 | 105.9 | 48.0 | 35.9 (-1.6) |
| 2004.11 | 113.2 | 43.5 | 35.3 (-0.6) |
| 2004.12 | 94.5 | 17.9 | 35.2 (-0.1) |
| 2005.01 | 102.2 | 31.3 | (34.6 predicted, -0.6) |
| 2005.02 | 97.2 | 29.1 | (33.3 predicted, -1.3) |
| 2005.03 | 89.9 | 24.8 | (31.6 predicted, -1.7) |
| 2005.04 | 86.0 | 24.4 | (29.7 predicted, -1.9) |
| 2005.05 | 99.3 | 42.6 | (27.2 predicted, -2.5) |
| 2005.06 | 93.7 | 39.3 | (25.7 predicted, -1.5) |
| 2005.07 | 120.3 (1) | 44.2 (2) | (24.7 predicted, -1.0) |
1) Running average based on the daily 20:00 UTC observed solar flux
value at 2800 MHz.
2) Unofficial, accumulated value based on the Boulder (NOAA/SEC)
sunspot number. The official international sunspot number is typically
30-50% lower.
This report has been prepared by Jan Alvestad. It is based partly on my own observations and analysis, and partly on data from some of these solar data sources. All time references are to the UTC day. Comments and suggestions are always welcome.
| [DX-Listeners' Club] |