
Last major update issued on January 7, 2005 at 03:45 UTC.
[Solar and geomagnetic data - last month (updated daily)]
[Solar wind and electron fluence charts (updated daily)]
[Solar cycles 21-23 (last update January 2, 2005)]
[Solar cycles 1-20]
[Graphical comparison of cycles 21, 22 and 23 (last update January 2, 2005)]
[Graphical comparison of cycles 2, 10, 13, 17, 20 and 23 (last update January
2, 2005)]
[Historical solar and geomagnetic data charts 1954-2004 (last update November 8,
2004)]
[Archived reports (last update January 2, 2005)]
The geomagnetic field was inactive to unsettled on January 6. Solar wind speed ranged between 478 and 583 km/sec, generally decreasing all day.
Solar flux measured at 20h UTC on 2.8 GHz was 83.2. The planetary A
index was 4 (STAR Ap - based on the mean of three hour interval ap indices: 3.9).
Three hour interval K indices: 20000131 (planetary), 10000121 (Boulder).
The background x-ray flux is at the class A6 level.
At midnight there were 2 spotted regions on the visible solar disk. The solar flare activity level was very low. No C class events were recorded during the day.
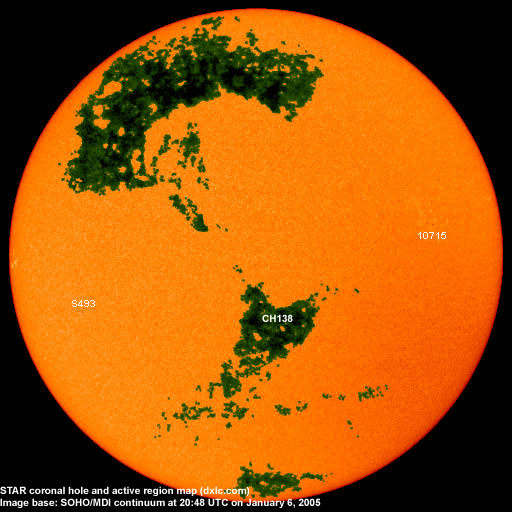
Region 10715 decayed slowly and had a single small spot left at midnight, the region could become spotless today.Spotted regions not numbered by SEC/NOAA:
[S493] This region emerged in the southeast quadrant early in the day and was at its peak an HSX region with an area of
20 mills. Decay was observed during the latter half of the day. At midnight the single spot had become tiny and the region could
easily become spotless today.
January 6: No obvious fully or partly Earth directed CMEs were observed.
January 5: Two CMEs of interest were observed during the day. The first was a very faint partial halo CME where most of the
ejected material was observed over the west limbs. Its source was probably a filament eruption (associated with a B class long
duration x-ray event) near region 10715. This event occurred approximately between 04 and 06h UTC. The second CME is more
interesting as it was more obvious, full halo, and likely has a larger potential for causing a geomagnetic disturbance. Its source
was a fairly large filament eruption in the northeast quadrant near 14h UTC. The coronal hole image below outlines the filament as
it is about to erupt, the shape of the filament is an elongated number 2.
January 4: An extremely faint and slow full halo CME was observed in LASCO C3 images after noon. This CME was likely
associated with a C7 flare in region 10715.
Coronal hole history (since late October 2002)
Compare today's report with the situation one solar rotation ago: 28
days ago 27 days ago 26 days ago
A recurrent coronal hole in the southern hemisphere will likely be in a geoeffective position on January 6-7. The associated high speed stream could become geoeffective on January 9 or 10.
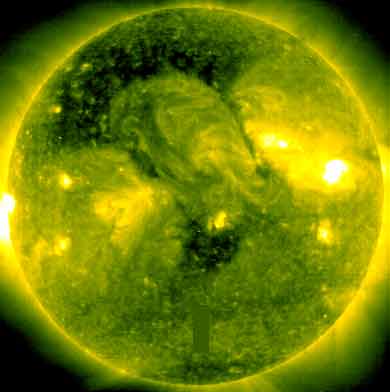
Processed SOHO/EIT 284 image at 01:06 UTC on January 6. The darkest areas on the solar disk are likely coronal holes.
The geomagnetic field is expected to be quiet to unsettled on January 7. A weak CME impact is possible and could cause occasional active intervals. A more significant CME is likely to arrive on January 8 and may cause unsettled to minor storm conditions. Quiet to active is possible on January 9 due to this CME and the arrival of a coronal hole flow from CH138.
| Coronal holes (1) | Coronal mass ejections (2) | M and X class flares (3) |
1) Effects from a coronal hole could reach Earth within the next 5 days. When the high speed stream has arrived
the color changes to green.
2) Material from a CME is likely to impact Earth within 96 hours.
3) There is a possibility of either M or X class flares within the next 48 hours.
Green: 0-20% probability, Yellow: 20-60% probability, Red: 60-100% probability.
Long distance low and medium frequency (below 2 MHz) propagation along east-west paths over high and upper middle latitudes is poor and slowly improving. Propagation along long distance north-south paths is poor. Trans Atlantic propagation conditions are normally monitored every night on 1470 kHz. Dominant station tonight: Radio Vibraci�n (Venezuela) with a fair signal, several unidentified stations were noted at times. WDHP on 1620 kHz had a good signal and several stations from the northeastern part of the USA had fair signals. Propagation is still best above 1400 kHz.
Compare to the previous day's image.
Data for all numbered solar regions according to the Solar Region Summary provided by NOAA/SEC. Comments are my own, as is the STAR spot count (spots observed at or inside a few hours before midnight) and data for regions not numbered by SEC or where SEC has observed no spots. SEC active region numbers in the table below and in the active region map above are the historic SEC/USAF numbers.
| Active region | Date numbered | SEC spot count |
STAR spot count |
Location at midnight | Area | Classification | Comment |
|---|---|---|---|---|---|---|---|
| 10715 | 2004.12.28 | 4 | 1 | N04W46 | 0030 | DSO |
classification was HSX at midnight, area 0010 |
| 10716 | 2004.12.30 | S13W42 | plage | ||||
| S493 | emerged on 2005.01.06 |
1 | S16E46 | 0000 | AXX | ||
| Total spot count: | 4 | 2 | |||||
| SSN: | 14 | 22 | |||||
| Month | Average solar flux at Earth |
International sunspot number | Smoothed sunspot number |
|---|---|---|---|
| 2000.04 | 184.2 | 125.5 | 120.8 cycle 23 sunspot max. |
| 2000.07 | 202.3 | 170.1 | 119.8 |
| 2001.12 | 235.1 | 132.2 | 114.6 (-0.9) |
| 2003.11 | 140.8 | 67.3 | 56.7 (-1.5) |
| 2003.12 | 114.9 | 46.5 | 54.8 (-1.9) |
| 2004.01 | 114.1 | 37.3 | 52.0 (-2.8) |
| 2004.02 | 107.0 | 45.8 | 49.3 (-2.7) |
| 2004.03 | 112.0 | 49.1 | 47.1 (-2.2) |
| 2004.04 | 101.2 | 39.3 | 45.5 (-1.6) |
| 2004.05 | 99.8 | 41.5 | 43.9 (-1.6) |
| 2004.06 | 97.4 | 43.2 | 41.7 (-2.2) |
| 2004.07 | 119.1 | 51.0 | (39.6 predicted, -1.9) |
| 2004.08 | 109.6 | 40.9 | (38.0 predicted, -1.6) |
| 2004.09 | 103.1 | 27.7 | (36.1 predicted, -1.9) |
| 2004.10 | 105.9 | 48.4 | (33.9 predicted, -2.2) |
| 2004.11 | 113.2 | 43.7 | (32.0 predicted, -1.9) |
| 2004.12 | 94.5 | 17.9 | (29.7 predicted, -2.3) |
| 2005.01 | 92.1 (1) | 6.6 (2) | (27.0 predicted, -2.7) |
1) Running average based on the daily 20:00 UTC observed solar flux value at 2800 MHz.
2) Unofficial, accumulated value based on the Boulder (NOAA/SEC) sunspot number. The official international sunspot number is typically
30-50% less.
This report has been prepared by Jan Alvestad. It is based partly on my own observations and analysis, and partly on data from some of these solar data sources. All time references are to the UTC day. Comments and suggestions are always welcome.
| [DX-Listeners' Club] |