
Last major update issued on January 16, 2005 at 05:20 UTC.
[Solar and
geomagnetic data - last month (updated daily)]
[Solar wind and
electron fluence charts (updated daily)]
[Solar cycles 21-23
(last update January 2, 2005)]
[Solar cycles 1-20]
[Graphical comparison
of cycles 21, 22 and 23 (last update January 2, 2005)]
[Graphical
comparison of cycles 2, 10, 13, 17, 20 and 23 (last update January
2, 2005)]
[Historical solar and
geomagnetic data charts 1954-2004 (last update November 8,
2004)]
[Archived reports
(last update January 12, 2005)]
The geomagnetic field was quiet to major storm on January 15. Solar wind speed ranged between 527 and 706 km/sec under the influence of a high speed stream from coronal hole CH139.
Solar flux measured at 20h UTC on 2.8 GHz was 144.9. The planetary
A
index was 22 (STAR Ap - based on the mean of three hour interval ap
indices: 22.5).
Three hour interval K indices: 36433332 (planetary), 35433332 (Boulder).
The background x-ray flux is at the class C1 level.
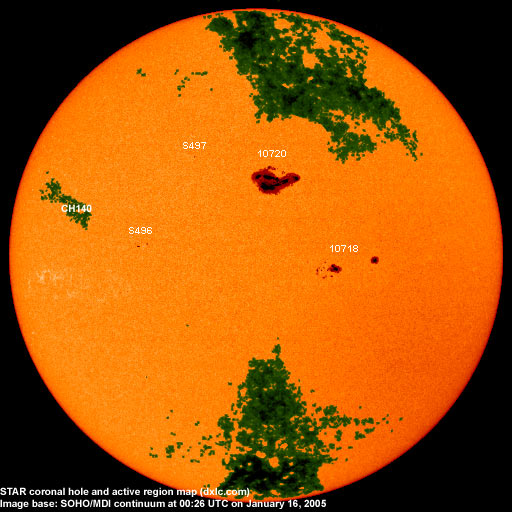
At midnight there were 4 spotted regions on the visible solar disk. The solar flare activity level was high. A total of 17 C, 7 M and 2 X class events was recorded during the day.
Region 10718 decayed slowly, the magnetic delta structure in the trailing spot section has become much smaller. A minor M class flare is possible. Flare: M3.2 at 14:23 UTC.Spotted regions not numbered by NOAA/SEC:
S496: This region emerged on January 15 in the southeast
quadrant. Location at midnight: S02E27
S497: A new region emerged in the northeast quadrant late on
January 15. Location at midnight: N19E15.
January 15: At least two fully Earth directed CMEs were launched
during the day. The first one was associated with a long duration M8
event in region 10720 after 06h UTC. This was a fast and large CME and
is likely to impact Earth during the latter half of January 16 and
cause major to very severe geomagnetic storming. The second significant
CME was launched during the the X2 long duration event in region 10720
late in the day. Again this was a large and fast CME and will likely
reach Earth on January 17 and extend the disturbance already in
progress.
January 13-14: No obvious fully or partly Earth directed CMEs
were observed.
Coronal hole
history (since late October 2002)
Compare today's report with the situation one solar rotation ago: 28
days ago 27 days ago 26 days ago
An extension (CH139) of a large coronal hole in the northern hemisphere was in a geoeffective position on January 9-11.

Processed SOHO/EIT 284 image at 01:06 UTC on January 16. The darkest areas on the solar disk are likely coronal holes.
The geomagnetic field is expected to be quiet to unsettled during
the first half of January 16. Sometime during the latter half of the
day a CME is likely to impact Earth and cause major to very severe
geomagnetic storming. This geomagnetic storm will continue on January
17 and be extended by another CME reaching the Earth sometime during
the day. Further major CMEs are likely from region 10720 over the next
days and the geomagnetic field is likely to remain at storm levels for
several days. Radio propagation over polar and near polar paths will
become severely degraded due to the storm and the proton levels.
| Coronal holes (1) | Coronal mass ejections (2) | M and X class flares (3) |
 |
1) Effects from a coronal hole could reach Earth
within the next 5 days. When the high speed stream has arrived
the color changes to green.
2) Material from a CME is likely to impact Earth within 96 hours.
3) There is a possibility of either M or X class flares within the next
48 hours.
Green: 0-20% probability, Yellow: 20-60% probability, Red: 60-100% probability.
Long distance low and medium frequency (below 2 MHz) propagation
along
east-west paths over high and upper middle latitudes is poor.
Propagation along long distance north-south paths is poor. Trans
Atlantic propagation conditions are normally monitored every night on
1470 kHz. Dominant stations tonight: Radio Cristal del
Uruguay and Radio Vibración (Venezuela) with weak signals. On
other frequencies North American stations were noted on 930, 1050, 1510
and 1540 kHz.
Compare to the previous day's image.
Data for all numbered solar regions according to the Solar Region Summary provided by NOAA/SEC. Comments are my own, as is the STAR spot count (spots observed at or inside a few hours before midnight) and data for regions not numbered by SEC or where SEC has observed no spots. SEC active region numbers in the table below and in the active region map above are the historic SEC/USAF numbers.
| Active region | Date numbered | SEC spot count |
STAR spot count |
Location at midnight | Area | Classification | Comment |
|---|---|---|---|---|---|---|---|
| 10718 | 2005.01.07 | 26 | 25 | S07W21 | 0360 | FKI | beta-gamma-delta |
| 10720 | 2005.01.10 | 54 | 41 | N13W03 | 1620 | DKC | delta classification was EKC at midnight, area 2100 location: N13W05 |
| S493 | emerged on 2005.01.06 |
S16W71 | plage | ||||
| S494 | emerged on 2005.01.13 |
S01W30 | plage | ||||
| S495 | visible on 2005.01.13 |
S06E56 | plage | ||||
| S496 | emerged on 2005.01.15 |
3 | S02E27 | 0030 | CAO | ||
| S497 | emerged on 2005.01.15 |
1 | N19E15 | 0010 | AXX | ||
| Total spot count: | 80 | 70 | |||||
| SSN: | 100 | 110 | |||||
| Month | Average solar flux at Earth |
International sunspot number | Smoothed sunspot number |
|---|---|---|---|
| 2000.04 | 184.2 | 125.5 | 120.8 cycle 23 sunspot max. |
| 2000.07 | 202.3 | 170.1 | 119.8 |
| 2001.12 | 235.1 | 132.2 | 114.6 (-0.9) |
| 2003.11 | 140.8 | 67.3 | 56.7 (-1.5) |
| 2003.12 | 114.9 | 46.5 | 54.8 (-1.9) |
| 2004.01 | 114.1 | 37.3 | 52.0 (-2.8) |
| 2004.02 | 107.0 | 45.8 | 49.3 (-2.7) |
| 2004.03 | 112.0 | 49.1 | 47.1 (-2.2) |
| 2004.04 | 101.2 | 39.3 | 45.5 (-1.6) |
| 2004.05 | 99.8 | 41.5 | 43.9 (-1.6) |
| 2004.06 | 97.4 | 43.2 | 41.7 (-2.2) |
| 2004.07 | 119.1 | 51.0 | (39.6 predicted, -1.9) |
| 2004.08 | 109.6 | 40.9 | (38.0 predicted, -1.6) |
| 2004.09 | 103.1 | 27.7 | (36.1 predicted, -1.9) |
| 2004.10 | 105.9 | 48.4 | (33.9 predicted, -2.2) |
| 2004.11 | 113.2 | 43.7 | (32.0 predicted, -1.9) |
| 2004.12 | 94.5 | 17.9 | (29.7 predicted, -2.3) |
| 2005.01 | 99.2 (1) | 21.1 (2) | (27.0 predicted, -2.7) |
1) Running average based on the daily 20:00 UTC observed solar flux
value at 2800 MHz.
2) Unofficial, accumulated value based on the Boulder (NOAA/SEC)
sunspot number. The official international sunspot number is typically
30-50% less.
This report has been prepared by Jan Alvestad. It is based partly on my own observations and analysis, and partly on data from some of these solar data sources. All time references are to the UTC day. Comments and suggestions are always welcome.
| [DX-Listeners' Club] |