
Last major update issued on January 17,
2005 at 05:10 UTC. Minor update posted at 14:00 UTC.
[Solar and
geomagnetic data - last month (updated daily)]
[Solar wind and
electron fluence charts (updated daily)]
[Solar cycles 21-23
(last update January 2, 2005)]
[Solar cycles 1-20]
[Graphical comparison
of cycles 21, 22 and 23 (last update January 2, 2005)]
[Graphical
comparison of cycles 2, 10, 13, 17, 20 and 23 (last update January
2, 2005)]
[Historical solar and
geomagnetic data charts 1954-2004 (last update November 8,
2004)]
[Archived reports
(last update January 12, 2005)]
The geomagnetic field was quiet to unsettled on January 16. Solar wind speed ranged between 526 and 655 km/sec. Solar wind changes were fairly complex during the day, particularly after 09h UTC. The total field of the interplanetary magnetic field became stronger and the IMF was at times moderately northwards and moderately southwards. A sustained interval of a moderately southwards IMF was observed from 22:30 UTC and for the remainder of the day. This caused minor geomagnetic storming early on January 17.
Solar flux measured at 20h UTC on 2.8 GHz was 144.5. The planetary
A
index was 12 (STAR Ap - based on the mean of three hour interval ap
indices: 11.5).
Three hour interval K indices: 22223322 (planetary), 22323423 (Boulder).
The background x-ray flux is at the class B9 level.
At midnight there were 6 spotted regions on the visible solar disk. The solar flare activity level was moderate. A total of 7 C and 2 M class events was recorded during the day.
Region 10718 decayed significantly in the trailing spot section. There is still a chance of a minor M class flare.Spotted regions not numbered by NOAA/SEC:
S498: This region emerged in the southeast quadrant on January
16. Location at midnight: S11E18
S499: A new region emerged near the southwest limb on January
16. Location at midnight: S05W76.
Comment added at 11:05 UTC on January 17, 2005: Region 10720 produced a very long duration X3.8 event peaking at 09:52 UTC. This event may have been triggered by an M1.8 flare in the same region at 07:58 UTC. Image analysis reveal that material was ejected at least twice during the major X3 event, first towards the northwest, then towards the north. While most of the material is not likely to have been directed at Earth, this event could cause major to severe geomagnetic storming when the associated CME impacts Earth, probably during the latter half of January 18.
Two CMEs have been observed by ACE today. The first one, likely the arrival of the CME observed after an M8 event in region 10720 on January 15, was recorded by ACE at 07:17 UTC when solar wind speed increased abruptly from 530 to 610 km/sec. This was a moderate solar wind "shock" (neither this nor the second "shock" mentioned below meet all shock criteria). A more significant shock was noted at about 10:42 UTC with a sudden increase in solar wind speed to nearly 700 km/sec. This was probably the arrival of the CME observed after the X2 event in region 10720 late on January 15.
Comment added at 14:00 UTC: A strong increase in proton levels have been observed at ACE. Currently all solar wind measurements are invalid due to the proton storm. The source of the proton storm is likely the major X3 LDE earlier today.
Severe geomagnetic storming has been observed since just before noon.
January 16: No CMEs observed, however, a type IV radio sweep was
reported during the M2 flare in region 10720 late in the
day and it is likely that there was a CME.
January 15: At least two fully Earth directed CMEs were launched
during the day. The first one was associated with a long duration M8
event in region 10720 after 06h UTC. This was a fast and large CME and
is likely to impact Earth during the latter half of January 16 and
cause major to very severe geomagnetic storming. The second significant
CME was launched during the the X2 long duration event in region 10720
late in the day. Again this was a large and fast CME and will likely
reach Earth on January 17 and extend the disturbance already in
progress.
January 14: No obvious fully or partly Earth directed CMEs
were observed.
Coronal hole
history (since late October 2002)
Compare today's report with the situation one solar rotation ago: 28
days ago 27 days ago 26 days ago
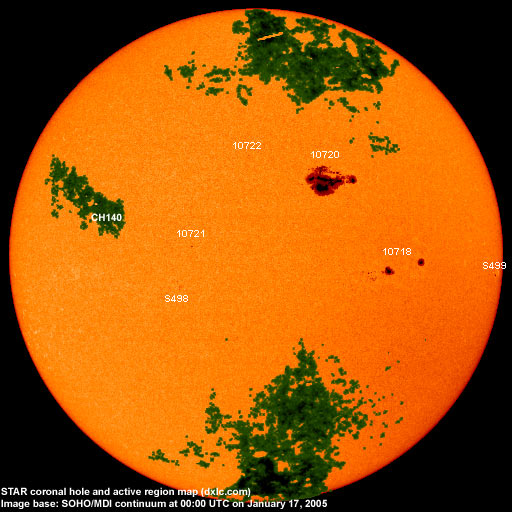
A recurrent coronal hole (CH140) in the northern hemisphere will likely rotate to a geoeffective position on January 19-20.

Processed SOHO/EIT 284 image at 13:06 UTC on January 16. The darkest areas on the solar disk are likely coronal holes.
The geomagnetic field is expected to be active to severe storm on
January 17 and unsettled to major storm on January 18 due to
CME effects.
| Coronal holes (1) | Coronal mass ejections (2) | M and X class flares (3) |
 |
1) Effects from a coronal hole could reach Earth
within the next 5 days. When the high speed stream has arrived
the color changes to green.
2) Material from a CME is likely to impact Earth within 96 hours.
3) There is a possibility of either M or X class flares within the next
48 hours.
Green: 0-20% probability, Yellow: 20-60% probability, Red: 60-100% probability.
Long distance low and medium frequency (below 2 MHz) propagation
along
east-west paths over high and upper middle latitudes is very poor.
Propagation along long distance north-south paths is poor. Trans
Atlantic propagation conditions are normally monitored every night on
1470 kHz. Dominant stations tonight: Radio Cristal del
Uruguay and Radio Vibración (Venezuela) with weak signals. On
other frequencies the only North American stations observed were 930
CJYQ and 1510 WWZN.
Compare to the previous day's image.
Data for all numbered solar regions according to the Solar Region Summary provided by NOAA/SEC. Comments are my own, as is the STAR spot count (spots observed at or inside a few hours before midnight) and data for regions not numbered by SEC or where SEC has observed no spots. SEC active region numbers in the table below and in the active region map above are the historic SEC/USAF numbers.
| Active region | Date numbered | SEC spot count |
STAR spot count |
Location at midnight | Area | Classification | Comment |
|---|---|---|---|---|---|---|---|
| 10718 | 2005.01.07 | 19 | 14 | S07W34 | 0310 | FAI | |
| 10720 | 2005.01.10 | 37 | 49 | N13W15 | 1620 | EKC | delta area was 2050 at midnight location: N13W18 |
| 10721 | 2005.01.16 | 2 | 1 | S03E14 | 0020 | CSO | classification was AXX at midnight, area 0010 |
| 10722 | 2005.01.16 | 1 | 1 | N19E04 | 0000 | AXX | |
| S493 | emerged on 2005.01.06 |
S16W84 | plage | ||||
| S494 | emerged on 2005.01.13 |
S01W43 | plage | ||||
| S495 | visible on 2005.01.13 |
S06E43 | plage | ||||
| S498 | emerged on 2005.01.16 |
5 | S11E18 | 0010 | AXX | ||
| S497 | emerged on 2005.01.15 |
1 | S05W76 | 0020 | HSX | ||
| Total spot count: | 59 | 71 | |||||
| SSN: | 99 | 131 | |||||
| Month | Average solar flux at Earth |
International sunspot number | Smoothed sunspot number |
|---|---|---|---|
| 2000.04 | 184.2 | 125.5 | 120.8 cycle 23 sunspot max. |
| 2000.07 | 202.3 | 170.1 | 119.8 |
| 2001.12 | 235.1 | 132.2 | 114.6 (-0.9) |
| 2003.11 | 140.8 | 67.3 | 56.7 (-1.5) |
| 2003.12 | 114.9 | 46.5 | 54.8 (-1.9) |
| 2004.01 | 114.1 | 37.3 | 52.0 (-2.8) |
| 2004.02 | 107.0 | 45.8 | 49.3 (-2.7) |
| 2004.03 | 112.0 | 49.1 | 47.1 (-2.2) |
| 2004.04 | 101.2 | 39.3 | 45.5 (-1.6) |
| 2004.05 | 99.8 | 41.5 | 43.9 (-1.6) |
| 2004.06 | 97.4 | 43.2 | 41.7 (-2.2) |
| 2004.07 | 119.1 | 51.0 | (39.6 predicted, -1.9) |
| 2004.08 | 109.6 | 40.9 | (38.0 predicted, -1.6) |
| 2004.09 | 103.1 | 27.7 | (36.1 predicted, -1.9) |
| 2004.10 | 105.9 | 48.4 | (33.9 predicted, -2.2) |
| 2004.11 | 113.2 | 43.7 | (32.0 predicted, -1.9) |
| 2004.12 | 94.5 | 17.9 | (29.7 predicted, -2.3) |
| 2005.01 | 102.1 (1) | 24.3 (2) | (27.0 predicted, -2.7) |
1) Running average based on the daily 20:00 UTC observed solar flux
value at 2800 MHz.
2) Unofficial, accumulated value based on the Boulder (NOAA/SEC)
sunspot number. The official international sunspot number is typically
30-50% less.
This report has been prepared by Jan Alvestad. It is based partly on my own observations and analysis, and partly on data from some of these solar data sources. All time references are to the UTC day. Comments and suggestions are always welcome.
| [DX-Listeners' Club] |