
Last major update issued on July 15, 2005 at 05:25 UTC.
[Solar and
geomagnetic data - last month (updated daily)]
[Solar wind and
electron fluence charts (updated daily)]
[Solar cycles 21-23
(last update July 2, 2005)]
[Solar cycles 1-20]
[Graphical comparison
of cycles 21, 22 and 23 (last update July 2, 2005)]
[Graphical
comparison of cycles 2, 10, 13, 17, 20 and 23 (last update July 2, 2005)]
[Historical solar and
geomagnetic data charts 1954-2004 (last update February 1, 2005)]
[Archived reports
(last update July 2, 2005)]
The geomagnetic field was quiet to active on July 14. Solar wind speed ranged between 445 and 565 (all day average 498) km/sec.
Solar flux measured at 20h UTC on 2.8 GHz was 89.9. The planetary
A
index was 11 (STAR Ap - based on the mean of three hour interval ap
indices: 11.0).
Three hour interval K indices: 24332211 (planetary), 24322221 (Boulder).
The background x-ray flux is at the class B7 level.
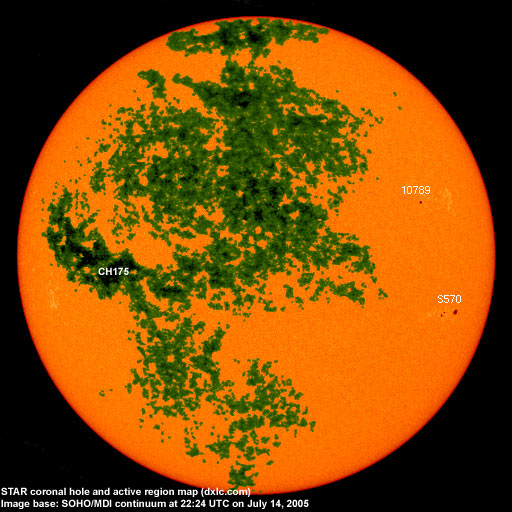
At midnight there were 2 spotted regions on the visible solar disk. The solar flare activity level was high. A total of 9 C 3 M and 1 X class events was recorded during the day.
Region 10786 rotated out of view at the northwest limb while flare activity increased further. A major flare from behind the limb
is possible today and tomorrow. Flares: C3.8 at 01:56, M1.0 at 03:23, C2.2 at 05:28, impulsive
major M9.1/1N at 07:25, long duration major X1.2 proton event peaking at 10:55 (associated with a moderate type II radio sweep and
a large and very wide full halo CME), C7.3 at 16:34, M1.3 at 17:25 and M1.1 at 22:57 UTC (in addition to several smaller C
flares).
Region 10789 lost the leader spots.
Region 10790 decayed and lost all spots.
The above 10 MeV proton event currently in progress has so far peaked near the 120 pfu level.
Spotted regions not numbered by NOAA/SEC:
[S570] This region emerged in the southwest quadrant on July 13 just west of region 10790. Location at
midnight: S12W55.
July 12: The M1 long duration event in region 10786 during the afternoon was associated with a faint full halo CME. While
parts of this CME were visible over the northwest limb at 17:42 UTC, it wasn't until 3 hours later that this developed into a full
halo CME when much fainter extensions became visible over the east limb in LASCO C3 images.
July 13: A large, wide and fast full halo CME was observed during the afternoon and early evening in LASCO C3 images after
the M5 long duration event in region 10786.
July 14: A large, fast and very wide full halo CME was observed in LASCO C3 images after the X1 event in region 10786.
Coronal hole
history (since late October 2002)
Compare today's report with the situation one solar rotation ago: 28
days ago 27 days ago 26
days ago
A recurrent trans equatorial coronal hole (CH175) will rotate into an Earth facing position on July 17-18.

Processed SOHO/EIT 284 image at 01:06 UTC on July 15. The darkest areas on the solar disk are likely coronal holes.
The geomagnetic field is expected to be quiet to minor storm on July 15 and unsettled to major storm on July 16. An isolated severe storm interval is possible on July 16 after the arrival of the CME observed following the X1 event in region 10786 on July 14. Quiet to minor storm is expected for July 17 becoming quiet to unsettled on July 18-19.
| Coronal holes (1) | Coronal mass ejections (2) | M and X class flares (3) |
1) Effects from a coronal hole could reach Earth
within the next 5 days. When the high speed stream has arrived
the color changes to green.
2) Material from a CME is likely to impact Earth within 96 hours.
3) There is a possibility of either M or X class flares within the next
48 hours.
Green: 0-20% probability, Yellow: 20-60% probability, Red: 60-100% probability.
Long distance low and medium frequency (below 2 MHz) propagation along east-west paths over high and upper middle latitudes is very poor. Propagation along long distance north-south paths is poor. Trans Atlantic propagation conditions are normally monitored every night on 1470 kHz. Dominant station tonight: Radio Cristal del Uruguay. While there were many carriers on other frequencies, audio was only observed on frequencies like 1410 (AM Libre - Uruguay), 1480 (probably Paraguay), 1500 (Argentina) and 1510 kHz (Uruguay and Argentina).
Compare to the previous day's image.
Data for all numbered solar regions according to the Solar Region Summary provided by NOAA/SEC. Comments are my own, as is the STAR spot count (spots observed at or inside a few hours before midnight) and data for regions not numbered by SEC or where SEC has observed no spots. SEC active region numbers in the table below and in the active region map above are the historic SEC/USAF numbers.
| Active region | Date numbered | SEC spot count |
STAR spot count |
Location at midnight | Area | Classification | Comment |
|---|---|---|---|---|---|---|---|
| 10786 | 2005.07.01 | 4 | N12W97 | 0300 | DKO | rotated out of view | |
| 10788 | 2005.07.02 | 1 | S04W91 | 0030 | HSX | rotated out of view | |
| 10789 | 2005.07.03 | 5 | 1 | N17W49 | 0030 | CSO | classification was HSX at midnight, area 0020, location: N16W46 |
| 10790 | 2005.07.13 | 11 | S10W48 (SEC: S10W54) |
0040 | CSI | region is spotless, SEC unfortunately did not observe the presence of two regions on July 13 and when region 10790 lost its spots, the region number was reused | |
| S567 | 2005.07.03 | S07W80 | plage | ||||
| S569 | 2005.07.12 | N06E29 | plage | ||||
| S570 | 2005.07.13 | 9 | S12W55 | 0070 | DAO | SEC has this as region 10790 | |
| Total spot count: | 21 | 10 | |||||
| SSN: | 61 | 30 | |||||
| Month | Average solar flux at Earth |
International sunspot number | Smoothed sunspot number |
|---|---|---|---|
| 2000.04 | 184.2 | 125.5 | 120.8 cycle 23 sunspot max. |
| 2000.07 | 202.3 | 170.1 | 119.8 |
| 2001.12 | 235.1 | 132.2 | 114.6 (-0.9) |
| 2004.05 | 99.8 | 41.5 | 43.8 (-1.7) |
| 2004.06 | 97.4 | 43.2 | 41.6 (-2.2) |
| 2004.07 | 119.1 | 51.1 | 40.2 (-1.4) |
| 2004.08 | 109.6 | 40.9 | 39.2 (-1.0) |
| 2004.09 | 103.1 | 27.7 | 37.5 (-1.7) |
| 2004.10 | 105.9 | 48.0 | 35.9 (-1.6) |
| 2004.11 | 113.2 | 43.5 | 35.3 (-0.6) |
| 2004.12 | 94.5 | 17.9 | 35.2 (-0.1) |
| 2005.01 | 102.2 | 31.3 | (34.6 predicted, -0.6) |
| 2005.02 | 97.2 | 29.1 | (33.3 predicted, -1.3) |
| 2005.03 | 89.9 | 24.8 | (31.6 predicted, -1.7) |
| 2005.04 | 86.0 | 24.4 | (29.7 predicted, -1.9) |
| 2005.05 | 99.3 | 42.6 | (27.2 predicted, -2.5) |
| 2005.06 | 93.7 | 39.3 | (25.7 predicted, -1.5) |
| 2005.07 | 111.0 (1) | 54.5 (2) | (24.7 predicted, -1.0) |
1) Running average based on the daily 20:00 UTC observed solar flux
value at 2800 MHz.
2) Unofficial, accumulated value based on the Boulder (NOAA/SEC)
sunspot number. The official international sunspot number is typically
30-50% lower.
This report has been prepared by Jan Alvestad. It is based partly on my own observations and analysis, and partly on data from some of these solar data sources. All time references are to the UTC day. Comments and suggestions are always welcome.
| [DX-Listeners' Club] |