
Last major update issued on July 30, 2005 at 05:50 UTC. Minor update posted at 06:40 UTC.
[Solar and
geomagnetic data - last month (updated daily)]
[Solar wind and
electron fluence charts (updated daily)]
[Solar cycles 21-23
(last update July 2, 2005)]
[Solar cycles 1-20]
[Graphical comparison
of cycles 21, 22 and 23 (last update July 2, 2005)]
[Graphical
comparison of cycles 2, 10, 13, 17, 20 and 23 (last update July 2, 2005)]
[Historical solar and
geomagnetic data charts 1954-2004 (last update February 1, 2005)]
[Archived reports
(last update July 19, 2005)]
The geomagnetic field was unsettled to active on July 29. Solar wind speed ranged between 531 and 661 (all day average 574) km/sec under the influence of a high speed stream from CH177.
Solar flux measured at 20h UTC on 2.8 GHz was 103.7. The planetary
A
index was 19 (STAR Ap - based on the mean of three hour interval ap
indices: 18.9).
Three hour interval K indices: 34343433 (planetary), 34344432 (Boulder).
The background x-ray flux is at the class B2 level.
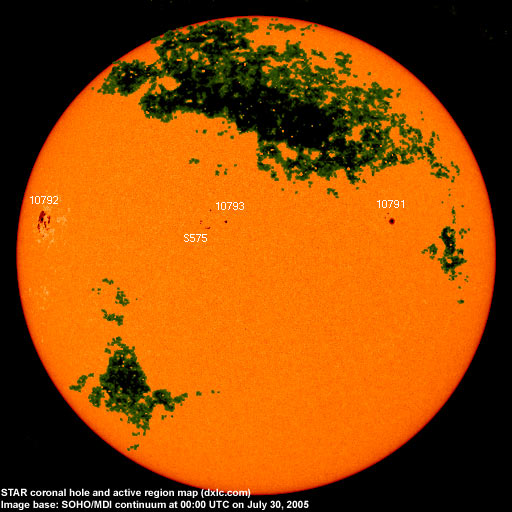
At midnight there were 4 spotted regions on the visible solar disk. The solar flare activity level was low. A total of 1 C class events was recorded during the day.
Region 10791 decayed slowly and quietly.
Region 10792 was mostly unchanged. The region remains capable of producing a major proton flare and has at least one
magnetic delta structure. Flare: C3.4 at 17:32 UTC.
New region 10793 emerged in the northeast quadrant on July 28 and was numbered the next day by SEC. The region appears to
be decaying slowly.
Spotted regions not numbered by NOAA/SEC:
[S575] This region emerged just east of region 10793 on July 29. Location at midnight: N13E13.
Comment added at 06:40 UTC on July 30: Region 10792 produced a long duration major X1.3 event peaking at 06:36 UTC. This may have been a proton flare as well and could be associated with a large partly Earth directed CME.
July 27-29: No obvious partly or fully Earth directed CMEs were observed.
Coronal hole
history (since late October 2002)
Compare today's report with the situation one solar rotation ago: 28
days ago 27 days ago 26
days ago
A recurrent trans equatorial coronal hole (CH177) was in an Earth facing position on July 25-26.

Processed SOHO/EIT 284 image at 03:17 UTC on July 30. The darkest areas on the solar disk are likely coronal holes.
The geomagnetic field is expected to be quiet to active on July 30, maybe with an isolated minor storm interval, and quiet to unsettled on July 31 and August 1.
| Coronal holes (1) | Coronal mass ejections (2) | M and X class flares (3) |
1) Effects from a coronal hole could reach Earth
within the next 5 days. When the high speed stream has arrived
the color changes to green.
2) Material from a CME is likely to impact Earth within 96 hours.
3) There is a possibility of either M or X class flares within the next
48 hours.
Green: 0-20% probability, Yellow: 20-60% probability, Red: 60-100% probability.
Long distance low and medium frequency (below 2 MHz) propagation along east-west paths over high and upper middle latitudes is poor. Propagation on long distance north-south paths is fair to good. Trans Atlantic propagation conditions are normally monitored every night on 1470 kHz. Dominant stations tonight: Radio Cristal del Uruguay and Radio Vibraci�n (Venezuela). Many stations from Argentina, Uruguay and Brazil were heard on other frequencies. Radio Belgrano (Suardi, Argentina) on 1510 had a good signal, as did several stations from the Buenos Aires area: 710 Radio Diez, 870 Radio Nacional, 950 Radio Belgrano, 1030 Radio del Plata, 1070 Radio El Mundo, 1190 Radio Am�rica and 1270 Radio Provincia de Buenos Aires.
Compare to the previous day's image.
Data for all numbered solar regions according to the Solar Region Summary provided by NOAA/SEC. Comments are my own, as is the STAR spot count (spots observed at or inside a few hours before midnight) and data for regions not numbered by SEC or where SEC has observed no spots. SEC active region numbers in the table below and in the active region map above are the historic SEC/USAF numbers.
| Active region | Date numbered | SEC spot count |
STAR spot count |
Location at midnight | Area | Classification | Comment |
|---|---|---|---|---|---|---|---|
| 10791 | 2005.07.23 | 6 | 3 | N14W33 | 0080 | CAO | classification was CSO at midnight |
| 10792 | 2005.07.28 | 28 | 31 | N11E66 | 0430 | EKC |
beta-gamma-delta classification was DKC at midnight, area 0600 |
| 10793 | 2005.07.29 | 5 | 5 | N14E11 | 0030 | DSO |
formerly region S574 location: N15E09 |
| S573 | 2005.07.23 | N15W84 | plage | ||||
| S575 | 2005.07.29 | 8 | N13E13 | 0040 | DAI | ||
| Total spot count: | 39 | 47 | |||||
| SSN: | 69 | 87 | |||||
| Month | Average solar flux at Earth |
International sunspot number | Smoothed sunspot number |
|---|---|---|---|
| 2000.04 | 184.2 | 125.5 | 120.8 cycle 23 sunspot max. |
| 2000.07 | 202.3 | 170.1 | 119.8 |
| 2001.12 | 235.1 | 132.2 | 114.6 (-0.9) |
| 2004.05 | 99.8 | 41.5 | 43.8 (-1.7) |
| 2004.06 | 97.4 | 43.2 | 41.6 (-2.2) |
| 2004.07 | 119.1 | 51.1 | 40.2 (-1.4) |
| 2004.08 | 109.6 | 40.9 | 39.2 (-1.0) |
| 2004.09 | 103.1 | 27.7 | 37.5 (-1.7) |
| 2004.10 | 105.9 | 48.0 | 35.9 (-1.6) |
| 2004.11 | 113.2 | 43.5 | 35.3 (-0.6) |
| 2004.12 | 94.5 | 17.9 | 35.2 (-0.1) |
| 2005.01 | 102.2 | 31.3 | (34.6 predicted, -0.6) |
| 2005.02 | 97.2 | 29.1 | (33.3 predicted, -1.3) |
| 2005.03 | 89.9 | 24.8 | (31.6 predicted, -1.7) |
| 2005.04 | 86.0 | 24.4 | (29.7 predicted, -1.9) |
| 2005.05 | 99.3 | 42.6 | (27.2 predicted, -2.5) |
| 2005.06 | 93.7 | 39.3 | (25.7 predicted, -1.5) |
| 2005.07 | 95.7 (1) | 63.2 (2) | (24.7 predicted, -1.0) |
1) Running average based on the daily 20:00 UTC observed solar flux
value at 2800 MHz.
2) Unofficial, accumulated value based on the Boulder (NOAA/SEC)
sunspot number. The official international sunspot number is typically
30-50% lower.
This report has been prepared by Jan Alvestad. It is based partly on my own observations and analysis, and partly on data from some of these solar data sources. All time references are to the UTC day. Comments and suggestions are always welcome.
| [DX-Listeners' Club] |