
Last major update issued on April 12, 2006 at 04:35 UTC.
[Solar and
geomagnetic data - last month (updated daily)]
[Solar wind and
electron fluence charts (updated daily)]
[Solar cycles 21-23
(last update April 1, 2006)]
[Solar cycles 1-20]
[Graphical comparison
of cycles 21, 22 and 23 (last update April 1, 2006)]
[Graphical
comparison of cycles 2, 10, 13, 17, 20 and 23 (last update April 1, 2006)]
[Historical solar and
geomagnetic data charts 1954-2005 (last update March 3, 2006)]
[Archived reports (last update
April 3, 2006)]
The geomagnetic field was quiet to unsettled on April 11. Solar wind speed ranged between 439 and 572 (all day average 506) km/sec.
Solar flux measured at 20h UTC on 2.8 GHz was 89.7 (this measurement was
influenced by the long duration event in region 10871, other measurements during
the evening indicated a value in the range 84-85). The planetary A index was 5 (STAR Ap - based on the mean of three hour interval ap
indices: 5.1).
Three hour interval K indices: 23011102 (planetary), 23022112 (Boulder).
The background x-ray flux is at the class A7 level.
At midnight there were 5 spotted regions on the visible solar disk. The solar flare activity level was low. A total of 3 C class events was recorded during the day.
Region 10869 decayed and lost the trailing spots.
Region 10870 decayed fairly quickly and could soon become spotless.
Flares: C1.0 at 02:00 and C1.0 at 04:39 UTC.
Region 10871 gained a couple of small spots.
Flare: C2.3/1N long duration event peaking at 18:39 UTC.
New region 10872 rotated into view at the southeast limb on April 11.
New region 10873 emerged in the southeast quadrant on April 10 and was
numbered the next day by SEC. The region developed on April 11 and could produce
C flares.
April 9-11: No partly or fully Earth directed CMEs were observed in LASCO imagery. A full halo diffuse CME was observed in LASCO C3 images starting at 12:40 UTC on April 10. Its source was likely backsided.
Coronal hole history (since late October 2002)
Compare today's report with the situation one solar rotation ago:
28 days ago
27 days ago
26 days ago
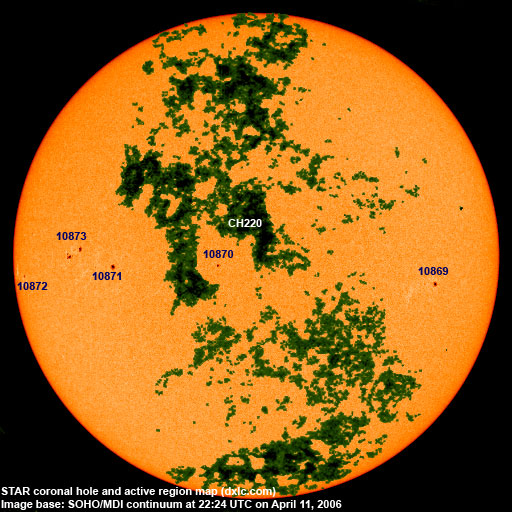
A recurrent trans equatorial coronal hole (CH220) will be in an Earth facing position on April 11-13.
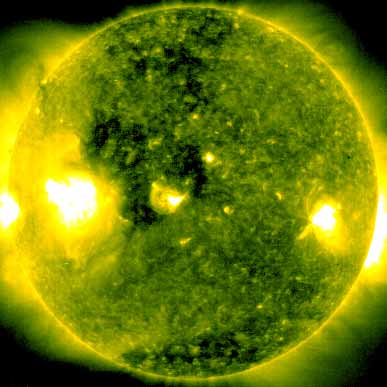
Processed SOHO/EIT 284 image at 01:06 UTC on April 11. The darkest areas on the solar disk are likely coronal holes.
The geomagnetic field is expected to be quiet on April 12-13 and quiet to minor storm on April 14-16 as a high speed stream from CH220 becomes the major solar wind factor.
| Coronal holes (1) | Coronal mass ejections (2) | M and X class flares (3) |
1) Effects from a coronal hole could reach Earth
within the next 5 days. When the high speed stream has arrived the color changes to green.
2) Effects from a CME are likely to be observed at Earth within 96 hours.
3) There is a possibility of either M or X class flares within the next 48 hours.
Green: 0-20% probability, Yellow: 20-60% probability, Red: 60-100% probability.
Long distance low and medium frequency (below 2 MHz) propagation along east-west paths over high and upper middle latitudes is very poor. Propagation on long distance northeast-southwest paths is fair. Trans Atlantic propagation conditions are normally monitored every night on 1470 kHz. Dominant stations tonight: Radio Vibraci�n (Venezuela) and CPN Radio (Per�). Unusual propagation was observed at local sunrise with 1700 KVNS noted as well as Mexico on 1570 kHz. On 1629.94 kHz a Spanish language station was audible, possibly the Fox Farm WY station.
Compare to the previous day's image.
Data for all numbered solar regions according to the Solar Region Summary provided by NOAA/SEC. Comments are my own, as is the STAR spot count (spots observed at or inside a few hours before midnight) and data for regions not numbered by SEC or where SEC has observed no spots. SEC active region numbers in the table below and in the active region map above are the historic SEC/USAF numbers.
| Active region | Date numbered | SEC spot count |
STAR spot count |
Location at midnight | Area | Classification | Comment |
|---|---|---|---|---|---|---|---|
| 10868 | 2006.04.05 | S07W84 | plage | ||||
| 10869 | 2006.04.06 | 7 | 4 | S12W44 | 0060 | DAO | classification was CAO at midnight, area 0040 |
| 10870 | 2006.04.10 | 3 | 2 | S08E09 | 0020 | HSX | |
| 10871 | 2006.04.10 | 2 | 3 | S08E39 | 0040 | HAX | classification was CAO at midnight, location: S07E36 |
| 10872 | 2006.04.11 | 1 | 1 | S09E74 | 0050 | HSX | area was 0010 at midnight |
| 10873 | 2006.04.11 | 10 | 10 | S04E48 | 0050 | DSO | formerly region S644 classification was DAO at midnight, area 0080 |
| S645 | 2006.04.10 | N05W05 | plage | ||||
| Total spot count: | 20 | 25 | |||||
| SSN: | 70 | 75 | |||||
| Month | Average solar flux at Earth |
International sunspot number | Smoothed sunspot number |
|---|---|---|---|
| 2000.04 | 184.2 | 125.5 | 120.8 cycle 23 sunspot max. |
| 2000.07 | 202.3 | 170.1 | 119.8 |
| 2001.12 | 235.1 | 132.2 | 114.6 (-0.9) |
| 2005.01 | 102.2 | 31.3 | 34.6 (-0.6) |
| 2005.02 | 97.2 | 29.2 | 33.9 (-0.7) |
| 2005.03 | 89.9 | 24.5 | 33.5 (-0.4) |
| 2005.04 | 86.0 | 24.2 | 31.6 (-1.9) |
| 2005.05 | 99.3 | 42.7 | 28.9 (-2.7) |
| 2005.06 | 93.7 | 39.3 | 28.8 (-0.1) |
| 2005.07 | 96.4 | 40.1 | 29.1 (+0.3) |
| 2005.08 | 90.5 | 36.4 | 27.4 (-1.7) |
| 2005.09 | 91.1 | 21.9 | 25.8 (-1.6) |
| 2005.10 | 77.0 | 8.5 | (24.8 predicted, -1.0) |
| 2005.11 | 86.3 | 18.0 | (22.7 predicted, -2.1) |
| 2005.12 | 90.7 | 41.2 | (19.8 predicted, -2.9) |
| 2006.01 | 83.4 | 15.4 | (16.7 predicted, -3.1) |
| 2006.02 | 76.5 | 4.7 | (13.6 predicted, -3.1) |
| 2006.03 | 75.4 | 10.8 | (11.4 predicted, -2.2) |
| 2006.04 | 93.5 (1) | 25.1 (2) | (10.7 predicted, -0.7) |
1) Running average based on the
daily 20:00 UTC observed solar flux
value at 2800 MHz.
2) Unofficial, accumulated value based on the Boulder (NOAA/SEC)
sunspot number. The official international sunspot number is typically
30-50% lower.
This report has been prepared by Jan Alvestad. It is based partly on my own observations and analysis, and partly on data from some of these solar data sources. All time references are to the UTC day. Comments and suggestions are always welcome.
| [DX-Listeners' Club] |