
Last major update issued on August 11, 2006 at 05:00 UTC.
[Solar and
geomagnetic data - last month (updated daily)]
[Solar wind and
electron fluence charts (updated daily)]
[Solar cycles 21-23
(last update August 6, 2006)]
[Solar cycles 1-20]
[Graphical comparison
of cycles 21, 22 and 23 (last update August 6, 2006)]
[Graphical
comparison of cycles 2, 10, 13, 17, 20 and 23 (last update August 6, 2006)]
[Historical solar and
geomagnetic data charts 1954-2005 (last update March 3, 2006)]
[Archived reports (last update
August 6, 2006)]
The geomagnetic field was quiet to unsettled on August 10. Solar wind speed ranged between 406 and 502 km/s (all day average 445 km/s - decreasing 72 km/s from the previous day).
Solar flux measured at 20h UTC on 2.8 GHz was 80.3. The planetary A index
was 5 (STAR Ap - based on the mean of three hour interval ap
indices: 4.8).
Three hour interval K indices: 11001203 (planetary), 10111212 (Boulder).
The background x-ray flux is at the class B4 level.
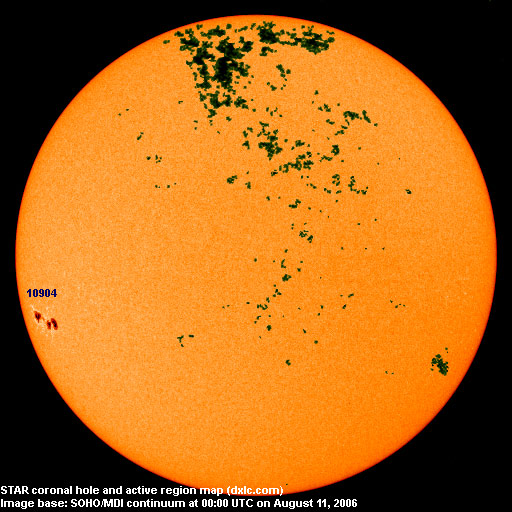
At midnight there was 1 spotted region on the visible solar disk. The solar flare activity level was low. A single C class event was recorded during the day.
Region 10904 developed quickly and is a large, compact and complex region. Negative polarity areas are in the eastern and westernmost sections as well as in the southwestern part of the central section. Two magnetic deltas were observed, one in the large trailing penumbra, another one in the southern part of the central southern penumbra. M class flares are likely, even a major flare is possible. Flare: C4.2 at 18:08 UTC.
August 8-10: No partly or fully Earth directed CMEs were detected in LASCO imagery.
Coronal hole history (since late October 2002)
Compare today's report to the situation one solar rotation ago:
28 days ago
27 days ago
26 days ago
No obvious coronal holes are currently in or approaching Earth facing positions.

Processed SOHO/EIT 284 image at 19:06 UTC on August 10. The darkest areas on the solar disk are likely coronal holes.
The geomagnetic field is expected to be quiet to unsettled on August 10 and quiet on August 11-13.
| Coronal holes (1) | Coronal mass ejections (2) | M and X class flares (3) |
1) Effects from a coronal hole could reach Earth
within the next 5 days. When the high speed stream has arrived the color changes to green.
2) Effects from a CME are likely to be observed at Earth within 96 hours.
3) There is a possibility of either M or X class flares within the next 48 hours.
Green: 0-20% probability, Yellow: 20-60% probability, Red: 60-100% probability.
Long distance low and medium frequency (below 2 MHz) propagation along east-west paths over high and upper middle latitudes is poor to fair. 1660 Relevant Radio (Florida) and 1130 WBBR had the best signals from North America. Cuba was heard with a surprisingly strong signal on 950 kHz (Radio Reloj). Several stations from Venezuela had good signals at 04h UTC. Propagation on long distance northeast-southwest paths is fair with the best signals coming from stations in the Buenos Aires area (710, 870, 950, 1190 and 1450 kHz).
Compare to the previous day's image.
Data for all numbered solar regions according to the Solar Region Summary provided by NOAA/SEC. Comments are my own, as is the STAR spot count (spots observed at or inside a few hours before midnight) and data for regions not numbered by SEC or where SEC has observed no spots. SEC active region numbers in the table below and in the active region map above are the historic SEC/USAF numbers.
| Active region | Date numbered | SEC spot count |
STAR spot count |
Location at midnight | Area | Classification | Comment |
|---|---|---|---|---|---|---|---|
| 10903 | 2006.08.07 | 6 | S09E29 | 0010 | BXO | spotless 2 consecutive days | |
| 10904 | 2006.08.09 | 11 | 22 | S13E63 | 0300 | EKC | beta-gamma-delta area was 0750 at midnight |
| Total spot count: | 17 | 22 | |||||
| SSN: | 37 | 32 | |||||
| Month | Average solar flux at Earth |
International sunspot number | Smoothed sunspot number |
|---|---|---|---|
| 2000.04 | 184.2 | 125.5 | 120.8 cycle 23 sunspot max. |
| 2000.07 | 202.3 | 170.1 | 119.8 |
| 2001.12 | 235.1 | 132.2 | 114.6 (-0.9) |
| 2005.06 | 93.7 | 39.3 | 28.8 (-0.1) |
| 2005.07 | 96.4 | 40.1 | 29.1 (+0.3) |
| 2005.08 | 90.5 | 36.4 | 27.4 (-1.7) |
| 2005.09 | 91.1 | 21.9 | 25.8 (-1.6) |
| 2005.10 | 77.0 | 8.5 | 25.5 (-0.3) |
| 2005.11 | 86.3 | 18.0 | 24.9 (-0.6) |
| 2005.12 | 90.7 | 41.2 | 23.0 (-1.9) |
| 2006.01 | 83.4 | 15.4 | 20.8 (-2.2) |
| 2006.02 | 76.5 | 4.7 | (18.4 predicted, -2.4) |
| 2006.03 | 75.4 | 10.8 | (16.6 predicted, -1.8) |
| 2006.04 | 89.0 | 30.2 | (15.9 predicted, -0.7) |
| 2006.05 | 80.9 | 22.2 | (15.1 predicted, -0.8) |
| 2006.06 | 76.5 | 13.9 | (12.9 predicted, -2.2) |
| 2006.07 | 75.7 | 12.2 | (11.4 predicted, -1.5) |
| 2006.08 | 72.0 (1) | 4.2 (2) | (11.4 predicted, -0.0) |
1) Running average based on the
daily 20:00 UTC observed solar flux
value at 2800 MHz.
2) Unofficial, accumulated value based on the Boulder (NOAA/SEC)
sunspot number. The official international sunspot number is typically
30-50% lower.
This report has been prepared by Jan Alvestad. It is based partly on my own observations and analysis, and partly on data from some of these solar data sources. All time references are to the UTC day. Comments and suggestions are always welcome.
| [DX-Listeners' Club] |