Last major update issued on December 11, 2006 at 04:20 UTC.
[Solar and
geomagnetic data - last month (updated daily)]
[Solar wind and
electron fluence charts (updated daily)]
[Solar cycles 21-23
(last update November 12, 2006)]
[Solar cycles 1-20]
[Graphical comparison
of cycles 21, 22 and 23 (last update November 12, 2006)]
[Graphical
comparison of cycles 2, 10, 13, 17, 20 and 23 (last update November 12,
2006)]
[Historical solar and
geomagnetic data charts 1954-2005 (last update March 3, 2006)]
[Archived reports
(last update November 12, 2006)]
The geomagnetic field was quiet to active on December 10. Solar wind speed ranged between 564 and 681 km/s (all day average 594 km/s - increasing 100 km/s over the previous day) under the influence of a high speed coronal hole stream. The source of this unexpected disturbance, which began late on December 9, will be investigated later today.
Solar flux measured at 20h UTC on 2.8 GHz was 90.0. The planetary A index was 14 (STAR Ap - based on the mean of three hour interval ap indices: 14.5). Three hour interval K indices: 23134433 (planetary), 13134423 (Boulder).
The background x-ray flux is at the class A5 level.
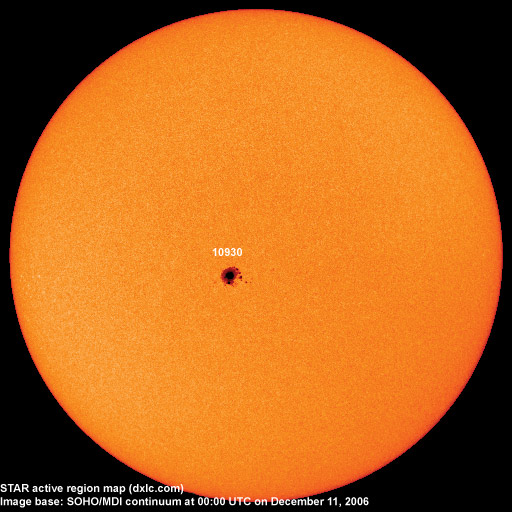
At midnight there was 1 spotted region on the visible solar disk. The solar flare activity level was very low. No C class event were recorded during the day.
Region 10930 developed slowly and added several spots ahead of the
main penumbra. There is still a weak magnetic delta structure in the
southernmost part of the main penumbra. The chance of an M class flare has
increased slightly over the last day.
December 8-10: No obvious partly or fully Earth directed CMEs were detected in LASCO imagery.
Coronal hole
history (since late October 2002)
Compare today's report to the situation one solar rotation ago:
28
days ago
27
days ago
26
days ago
No obvious coronal holes are currently in or approaching Earth facing positions.
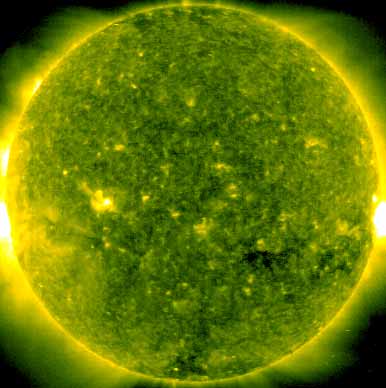
Processed SOHO/EIT 284 image at 19:06 UTC on November 24. The darkest areas on the solar disk are likely coronal holes.
The geomagnetic field is expected to be quiet to unsettled on December 11-12 and quiet on December 13.
| Coronal holes (1) | Coronal mass ejections (2) | M and X class flares (3) |
1) Effects from a coronal hole could reach Earth
within the next 5 days. When the high speed stream has arrived the
color changes to green.
2) Effects from a CME are likely to be observed at Earth within 96
hours.
3) There is a possibility of either M or X class flares within the next
48 hours.
Green: 0-20% probability, Yellow: 20-60% probability, Red: 60-100% probability.
Long distance low and medium frequency (below 2 MHz) propagation along east-west paths over high and upper middle latitudes is very poor. Propagation on long distance northeast-southwest paths is very poor.
Monitoring remarks from a location near N58E06: The only trans Atlantic station with audio at 03h UTC on the EWE antenna was 1510 WWZN, the signal was very weak.
Compare to the previous day's image.
Data for all numbered solar regions according to the Solar Region Summary provided by NOAA/SEC. Comments are my own, as is the STAR spot count (spots observed at or inside a few hours before midnight) and data for regions not numbered by SEC or where SEC has observed no spots. SEC active region numbers in the table below and in the active region map above are the historic SEC/USAF numbers.
| Active region | Date numbered | SEC spot count |
STAR spot count |
Location at midnight | Area | Classification | Comment |
|---|---|---|---|---|---|---|---|
| 10929 | 2006.12.04 | N03W11 | plage | ||||
| 10930 | 2006.12.04 | 13 | 14 | S05E06 | 0440 | CKI | beta-gamma-delta classification was DKC at midnight |
| Total spot count: | 13 | 14 | |||||
| SSN: | 23 | 24 | |||||
| Month | Average solar flux at Earth |
International sunspot number | Smoothed sunspot number |
|---|---|---|---|
| 2000.04 | 184.2 | 125.5 | 120.8 cycle 23 sunspot max. |
| 2000.07 | 202.3 | 170.1 | 119.8 |
| 2001.12 | 235.1 | 132.2 | 114.6 (-0.9) |
| 2005.09 | 91.1 | 21.9 | 25.8 (-1.6) |
| 2005.10 | 77.0 | 8.7 | 25.5 (-0.3) |
| 2005.11 | 86.3 | 18.0 | 24.9 (-0.6) |
| 2005.12 | 90.7 | 41.1 | 23.0 (-1.9) |
| 2006.01 | 83.4 | 15.3 | 20.8 (-2.2) |
| 2006.02 | 76.5 | 4.9 | 18.6 (-2.2) |
| 2006.03 | 75.4 | 10.6 | 17.3 (-1.3) |
| 2006.04 | 89.0 | 30.2 | 17.1 (-0.2) |
| 2006.05 | 80.9 | 22.2 | 17.3 (+0.2) |
| 2006.06 | 76.5 | 13.9 | (16.3 predicted, -1.0) |
| 2006.07 | 75.7 | 12.2 | (14.7 predicted, -1.6) |
| 2006.08 | 79.0 | 12.9 | (14.2 predicted, -0.5) |
| 2006.09 | 77.8 | 14.5 | (14.1 predicted, -0.1) |
| 2006.10 | 74.3 | 10.4 | (13.0 predicted, -1.1) |
| 2006.11 | 86.3 | 21.5 | (11.5 predicted, -1.5) |
| 2006.12 | 93.4 (1) | 13.6 (2) | (11.3 predicted, -0.2) |
1) Running average based on the
daily 20:00 UTC observed solar flux
value at 2800 MHz.
2) Unofficial, accumulated value based on the Boulder (NOAA/SEC)
sunspot number. The official international sunspot number is typically
30-50% lower.
This report has been prepared by Jan Alvestad. It is based partly on my own observations and analysis, and partly on data from some of these solar data sources. All time references are to the UTC day. Comments and suggestions are always welcome.
| [DX-Listeners' Club] |