
Last major update issued on March 19, 2006 at 05:45 UTC.
[Solar and
geomagnetic data - last month (updated daily)]
[Solar wind and
electron fluence charts (updated daily)]
[Solar cycles 21-23
(last update March 2, 2006)]
[Solar cycles 1-20]
[Graphical comparison
of cycles 21, 22 and 23 (last update March 2, 2006)]
[Graphical
comparison of cycles 2, 10, 13, 17, 20 and 23 (last update March 2, 2006)]
[Historical solar and
geomagnetic data charts 1954-2005 (last update March 3, 2006)]
[Archived reports (last update
March 2, 2006)]
The geomagnetic field was quiet to minor storm on March 18. Solar wind speed ranged between 380 and 602 (all day average 520) km/sec. A high speed stream from CH216 arrived near 07h UTC and caused a strong increase in geomagnetic activity.
Solar flux measured at 20h UTC on 2.8 GHz was 72.4. The planetary A index
was 26 (STAR Ap - based on the mean of three hour interval ap
indices: 26.5).
Three hour interval K indices: 11443555 (planetary), 02453444 (Boulder).
The background x-ray flux is at the class A2 level.
At midnight there were 2 spotted regions on the visible solar disk. The solar flare activity level was very low. No C class events were recorded during the day.
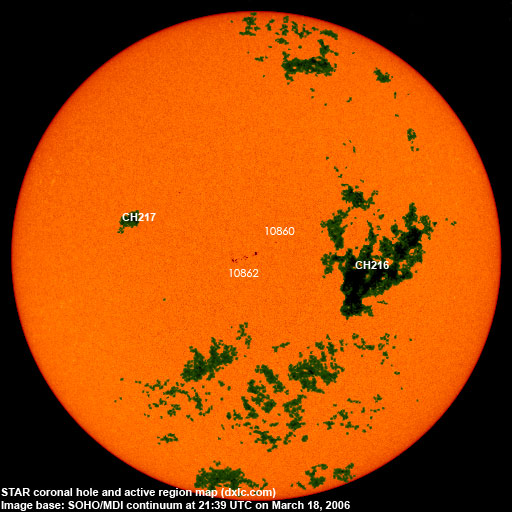
Region 10860 decayed slowly and quietly. The region was observed as
spotless early on March 19.
New region 10862 emerged quickly just southwest of region 10860. There is
some polarity intermixing as a negative polarity area has emerged inside the
trailing positive polarity area. Further rapid growth will make minor M class
flares a possibility.
An interesting duopole was observed at midnight at N45W37. While no spots were observed then, this area will be observed closely for further development.
March 16-18: No partly or fully Earth directed CMEs were observed in LASCO imagery.
Coronal hole history (since late October 2002)
Compare today's report with the situation one solar rotation ago:
28 days ago
27 days ago
26 days ago
A recurrent trans equatorial coronal hole (CH216) was in an Earth facing position on March 16-17. A coronal hole in the northern hemisphere will likely rotate to an Earth facing position on March 21.
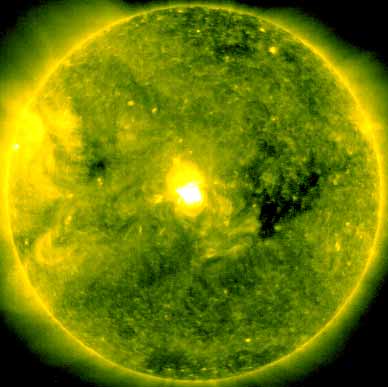
Processed SOHO/EIT 284 image at 01:06 UTC on March 19. The darkest areas on the solar disk are likely coronal holes.
The geomagnetic field is expected to be unsettled to major storm on March 19, quiet to minor storm on March 20 and quiet to unsettled on March 21-22.
| Coronal holes (1) | Coronal mass ejections (2) | M and X class flares (3) |
1) Effects from a coronal hole could reach Earth
within the next 5 days. When the high speed stream has arrived the color changes to green.
2) Effects from a CME are likely to be observed at Earth within 96 hours.
3) There is a possibility of either M or X class flares within the next 48 hours.
Green: 0-20% probability, Yellow: 20-60% probability, Red: 60-100% probability.
Long distance low and medium frequency (below 2 MHz) propagation along east-west paths over high and upper middle latitudes is very poor. Propagation on long distance northeast-southwest paths is fair to poor. Trans Atlantic propagation conditions are normally monitored every night on 1470 kHz. Dominant station tonight: Radio Vibraci�n (Venezuela). On other frequencies stations from Brazil (i.e. 840 and 1100 kHz) and Argentina (good signal on 700 kHz) were audible, as were several stations from Venezuela and a few from Per� (including Radio Santa Rosa on 1499.93 kHz).
Compare to the previous day's image.
Data for all numbered solar regions according to the Solar Region Summary provided by NOAA/SEC. Comments are my own, as is the STAR spot count (spots observed at or inside a few hours before midnight) and data for regions not numbered by SEC or where SEC has observed no spots. SEC active region numbers in the table below and in the active region map above are the historic SEC/USAF numbers.
| Active region | Date numbered | SEC spot count |
STAR spot count |
Location at midnight | Area | Classification | Comment |
|---|---|---|---|---|---|---|---|
| 10858 | 2006.03.12 | N18W66 | plage | ||||
| 10860 | 2006.03.14 | 2 | 1 | S04W03 | 0010 | HRX | classification at midnight was AXX, location S03W06 |
| 10861 | 2006.03.15 | S11E07 | plage | ||||
| 10862 | 2006.03.18 | 5 | 17 | S07E03 | 0020 | CSO | beta-gamma classification at midnight was DAI, area 0050 |
| S633 | 2006.03.17 | S12W08 | plage | ||||
| Total spot count: | 7 | 18 | |||||
| SSN: | 27 | 38 | |||||
| Month | Average solar flux at Earth |
International sunspot number | Smoothed sunspot number |
|---|---|---|---|
| 2000.04 | 184.2 | 125.5 | 120.8 cycle 23 sunspot max. |
| 2000.07 | 202.3 | 170.1 | 119.8 |
| 2001.12 | 235.1 | 132.2 | 114.6 (-0.9) |
| 2005.01 | 102.2 | 31.3 | 34.6 (-0.6) |
| 2005.02 | 97.2 | 29.2 | 33.9 (-0.7) |
| 2005.03 | 89.9 | 24.5 | 33.5 (-0.4) |
| 2005.04 | 86.0 | 24.2 | 31.6 (-1.9) |
| 2005.05 | 99.3 | 42.7 | 28.9 (-2.7) |
| 2005.06 | 93.7 | 39.3 | 28.8 (-0.1) |
| 2005.07 | 96.4 | 40.1 | 29.1 (+0.3) |
| 2005.08 | 90.5 | 36.4 | 27.4 (-1.7) |
| 2005.09 | 91.1 | 21.9 | (25.6 predicted, -1.8) |
| 2005.10 | 77.0 | 8.5 | (23.8 predicted, -1.8) |
| 2005.11 | 86.3 | 18.0 | (21.4 predicted, -2.4) |
| 2005.12 | 90.7 | 41.2 | (18.5 predicted, -2.9) |
| 2006.01 | 83.4 | 15.4 | (15.4 predicted, -3.1) |
| 2006.02 | 76.5 | 4.7 | (12.3 predicted, -3.1) |
| 2006.03 | 73.7 (1) | 9.7 (2) | (10.1 predicted, -2.2) |
1) Running average based on the
daily 20:00 UTC observed solar flux
value at 2800 MHz.
2) Unofficial, accumulated value based on the Boulder (NOAA/SEC)
sunspot number. The official international sunspot number is typically
30-50% lower.
This report has been prepared by Jan Alvestad. It is based partly on my own observations and analysis, and partly on data from some of these solar data sources. All time references are to the UTC day. Comments and suggestions are always welcome.
| [DX-Listeners' Club] |