Last major update issued on April 26, 2007 at 04:55 UTC.
[Solar and
geomagnetic data - last month (updated daily)]
[Solar wind and
electron fluence charts (updated daily)
[Solar cycles 21-23
(last update April 10, 2007)]
[Solar cycles 1-20]
[Graphical comparison
of cycles 21, 22 and 23 (last update April 10, 2007)]
[Graphical
comparison of cycles 2, 10, 13, 17, 20 and 23 (last update April 10, 2007)]
[Historical solar and
geomagnetic data charts 1954-2006 (last update April 5, 2007)]
[Archived reports
(last update April 7, 2007)]
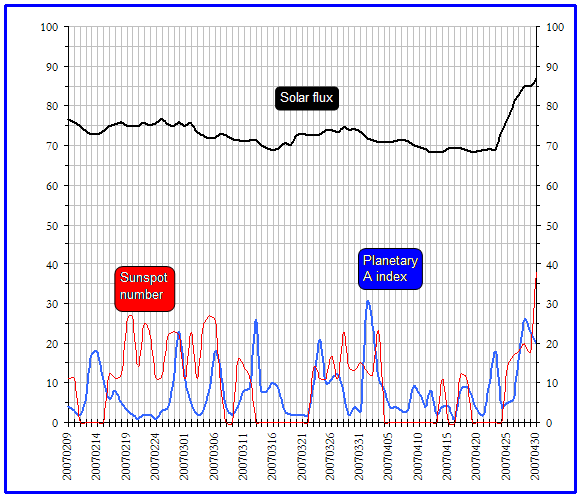
The geomagnetic field was quiet to unsettled on April 25. Solar wind speed ranged between 392 and 448 km/s (average speed was 426 km/s, increasing 5 km/s over the previous day).
Solar flux measured at 20h UTC on 2.8 GHz was 76.5. The planetary A index was 5 (STAR Ap - based on the mean of three hour interval ap indices: 4.8). Three hour interval K indices: 31002211 (planetary), 21102311 (Boulder).
The background x-ray flux is at the class A6 level.
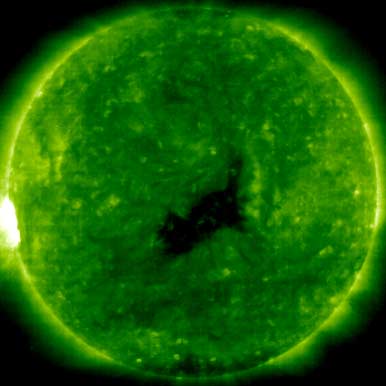
At midnight there was 1 spotted region on the visible solar disk. The solar flare activity level was very low. No C class events were recorded during the day.
New region 10953 rotated into view at the southeast limb. Polarity separation is relatively poor and C flares are possible.
April 23-25: No obvious fully or partially Earth directed CMEs were observed in LASCO imagery.
Coronal hole
history (since late October 2002)
Compare today's report to the situation one solar rotation ago:
28
days ago
27
days ago
26
days ago
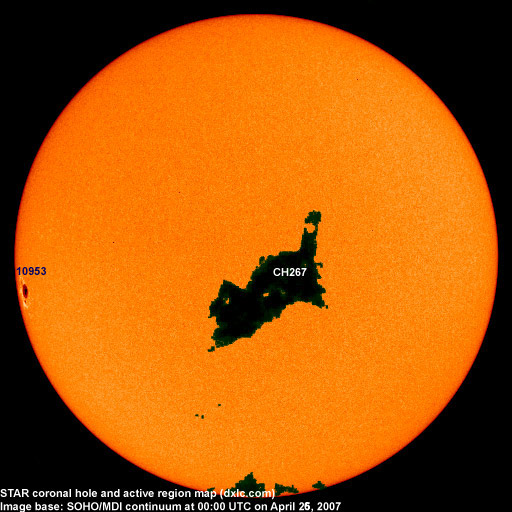
A recurrent coronal hole (CH267) in the southern hemisphere will be in an Earth facing position on April 24-26.
Processed SOHO/EIT 195 image at 19:48 UTC on April 25. The darkest areas on the solar disk are likely coronal holes.
The geomagnetic field is expected to be quiet to unsettled on April 26 becoming unsettled to minor storm on April 27-29 due to a high speed stream from CH267.
| Coronal holes (1) | Coronal mass ejections (2) | M and X class flares (3) |
1) Effects from a coronal hole could reach Earth
within the next 5 days. When the high speed stream has arrived the
color changes to green.
2) Effects from a CME are likely to be observed at Earth within 96
hours.
3) There is a possibility of either M or X class flares within the next
48 hours.
Green: 0-20% probability, Yellow: 20-60% probability, Red: 60-100% probability.
Daily monitoring will not resume until a local noise problem (related to construction work on a neighboring property) has been fixed. Occasional monitoring reports will be submitted when propagation is good.
April 8, 2007: Stations from the Canadian Atlantic provinces had strong signals during the night. Some stations from the northeastern USA and from Florida did well too, in particular 1510 WWZN was impressive.
Compare to the previous day's image.
Data for all numbered solar regions according to the Solar Region Summary provided by NOAA/SEC. Comments are my own, as is the STAR spot count (spots observed at or inside a few hours before midnight) and data for regions not numbered by SEC or where SEC has observed no spots. SEC active region numbers in the table below and in the active region map above are the historic SEC/USAF numbers.
| Active region | Date numbered | SEC spot count |
STAR spot count |
Location at midnight | Area | Classification | Comment |
|---|---|---|---|---|---|---|---|
| 10953 | 2007.04.25 | 4 | 6 | S14E73 | 0230 | HSX | classification was DKO at midnight; area 0300 |
| Total spot count: | 4 | 6 | |||||
| SSN: | 14 | 16 | |||||
| Month | Average solar flux at Earth |
International sunspot number | Smoothed sunspot number |
|---|---|---|---|
| 2000.04 | 184.2 | 125.5 | 120.8 cycle 23 sunspot max. |
| 2000.07 | 202.3 | 170.1 | 119.8 |
| 2001.12 | 235.1 | 132.2 | 114.6 (-0.9) |
| 2006.01 | 83.4 | 15.3 | 20.8 (-2.2) |
| 2006.02 | 76.5 | 4.9 | 18.6 (-2.2) |
| 2006.03 | 75.4 | 10.6 | 17.4 (-1.2) |
| 2006.04 | 89.0 | 30.2 | 17.1 (-0.3) |
| 2006.05 | 80.9 | 22.3 | 17.3 (+0.2) |
| 2006.06 | 76.5 | 13.9 | 16.3 (-1.0) |
| 2006.07 | 75.7 | 12.2 | 15.3 (-1.0) |
| 2006.08 | 79.0 | 12.9 | 15.6 (+0.3) |
| 2006.09 | 77.8 | 14.4 | 15.6 (+0.0) |
| 2006.10 | 74.3 | 10.4 | (14.3 predicted, -1.3) |
| 2006.11 | 86.3 | 21.5 | (12.6 predicted, -1.7) |
| 2006.12 | 84.5 | 13.6 | (11.6 predicted, -1.0) |
| 2007.01 | 83.3 | 16.9 | (11.2 predicted, -0.4) |
| 2007.02 | 77.7 | 10.6 | (11.1 predicted, -0.1) |
| 2007.03 | 72.2 | 4.8 | (11.3 predicted, +0.2) |
| 2007.04 | 70.1 (1) | 3.2 (2) | (11.9 predicted, +0.6) |
1) Running average based on the
daily 20:00 UTC observed solar flux
value at 2800 MHz.
2) Unofficial, accumulated value based on the Boulder (NOAA/SEC)
sunspot number. The official international sunspot number is typically
30-50% lower.
This report has been prepared by Jan Alvestad. It is based partly on my own observations and analysis, and partly on data from some of these solar data sources. All time references are to the UTC day. Comments and suggestions are always welcome.
| [DX-Listeners' Club] |