Last major update issued on March 5, 2014 at 05:10 UTC.
[Solar and geomagnetic data - last month (updated
daily)]
[Solar wind and
electron fluence charts (updated
daily)]
[Solar cycles 23-24 (last update March 1, 2014)] [Cycle
24 progress (last update March 1, 2014) ]
[Solar cycles 1-20]
[Graphical comparison of cycles 21, 22, 23 and 24 (last
update March 1, 2014)]
[Graphical comparison of cycles 10, 12, 13, 14, 16 and
24 (last update March 1, 2014)]
[Historical solar and geomagnetic data charts 1954-2006
(last update April 5, 2007)]
[Archived reports since January 2003 (last update
March 1, 2014)]
[POES auroral activity level since October
2009 - updated January 26, 2013]
[Solar polar fields vs solar cycles - updated
February 23, 2014]
[Presentation
3rd
SSN Workshop, Tucson, 2013 (pdf)]
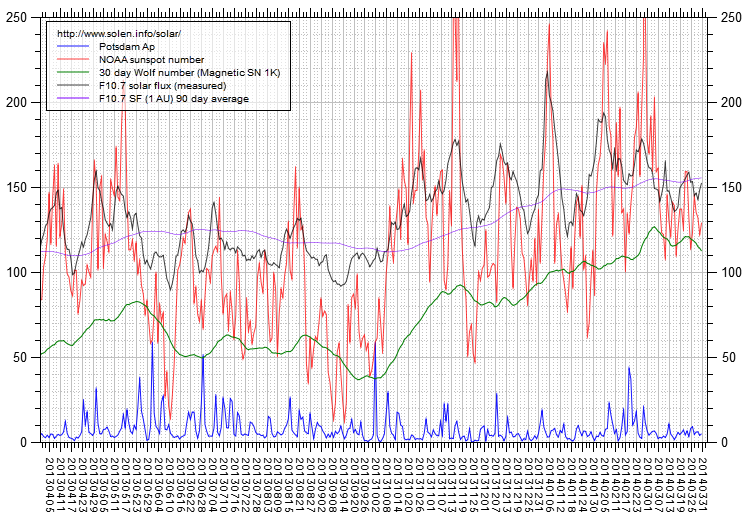
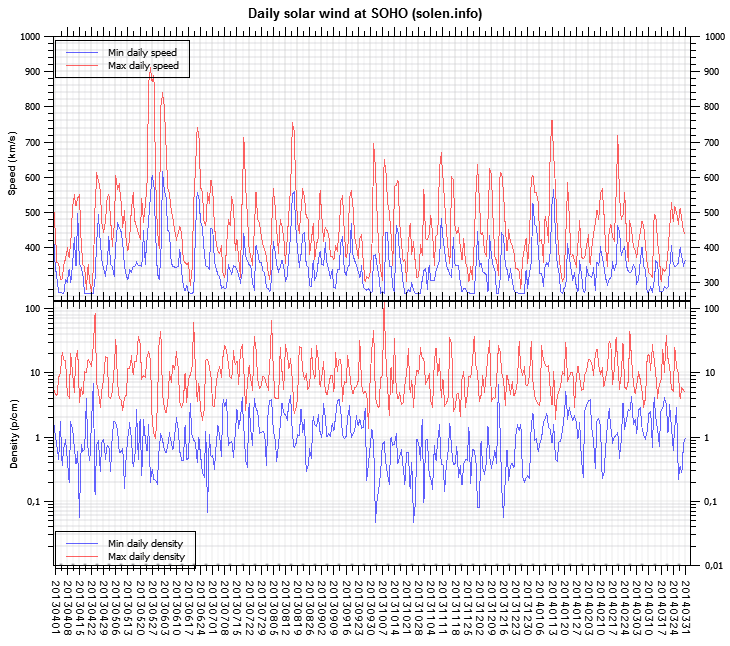
The geomagnetic field was quiet on March 4. Solar wind speed at SOHO ranged between 309 and 416 km/s.
Solar flux at 20h UTC on 2.8 GHz was 158.0 (decreasing 35.5 over the last solar rotation). The 90 day 10.7 flux at 1 AU was 154.8. The Potsdam WDC planetary A index was 6 (STAR Ap - based on the mean of three hour interval ap indices: 5.5). Three hour interval K indices: 21022112 (planetary), 22032312 (Boulder).
The background x-ray flux is at the class C1 level.
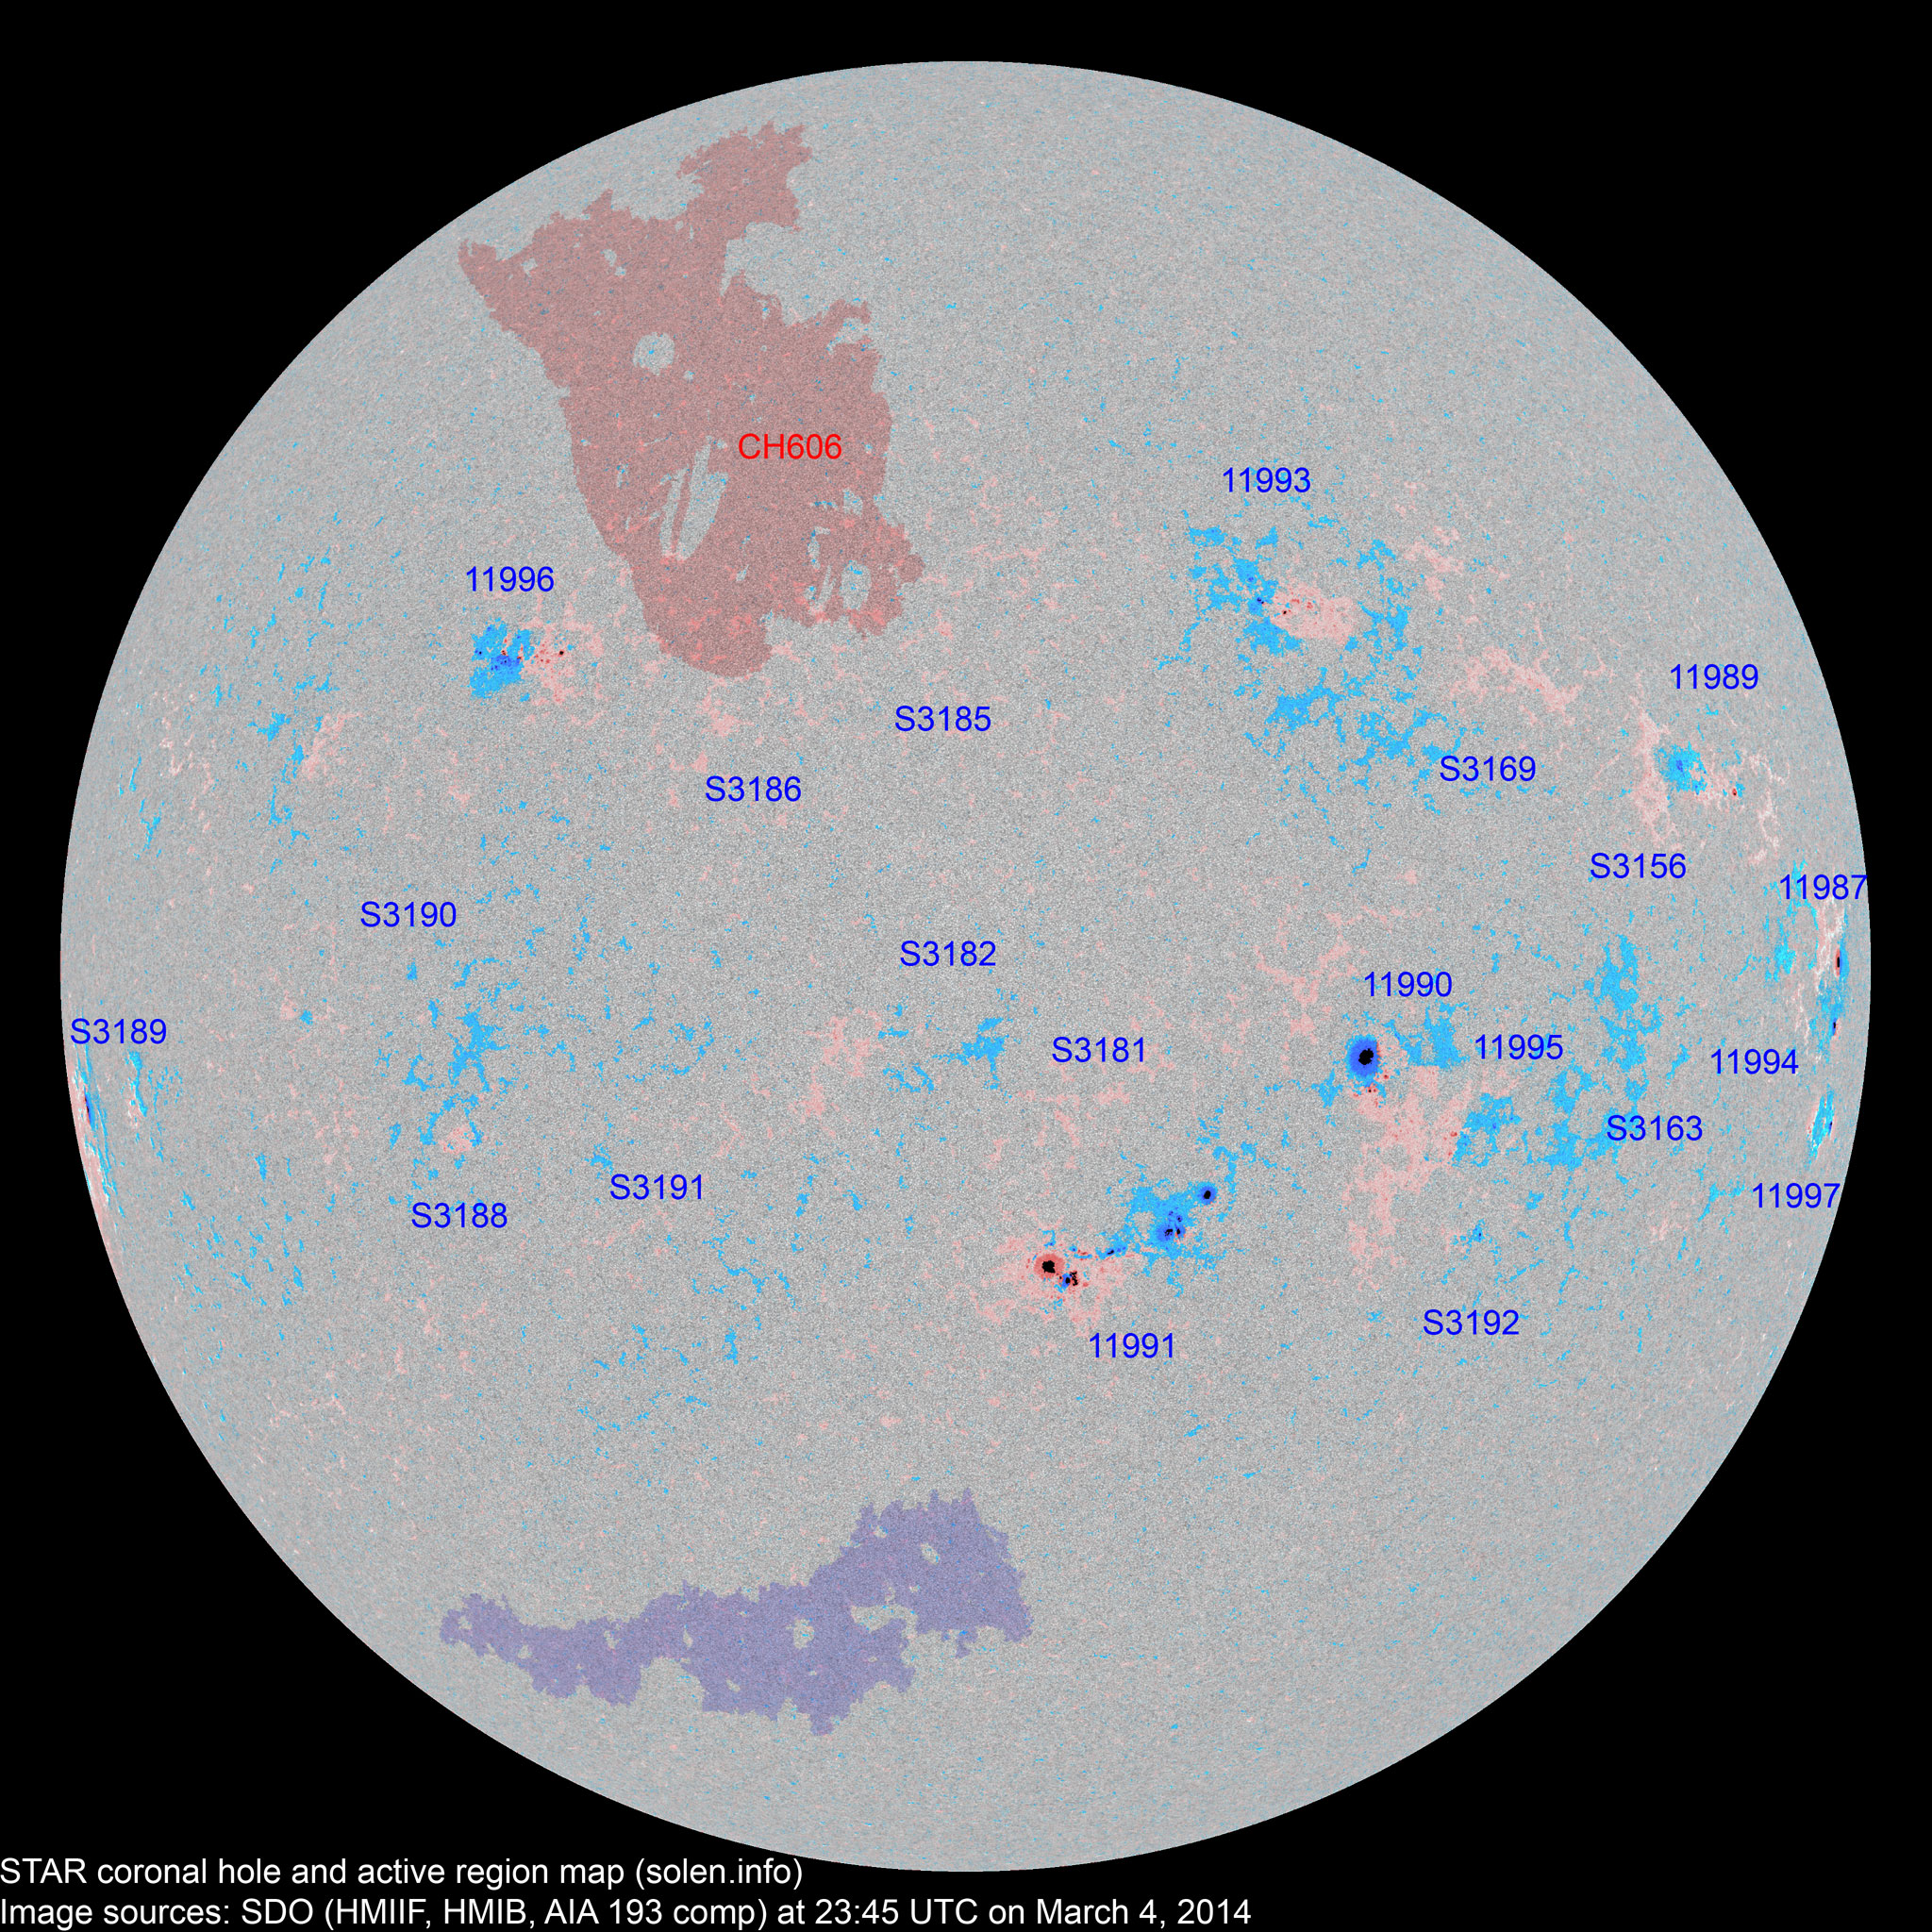
At the time of counting spots (see image time) spots were observed in 21 active regions in 2K resolution (SN: 402) and 15 active regions in 1K resolution (SN: 258) SDO images on the visible solar disk.
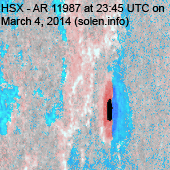
Region 11987 [S02W75] was quiet and stable.
Region 11989 [N08W55] decayed significantly and was quiet.
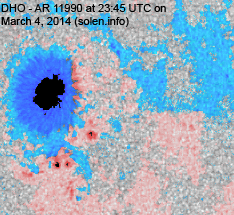
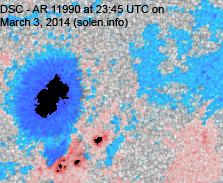
Region 11990 [S12W27] was quiet and stable.
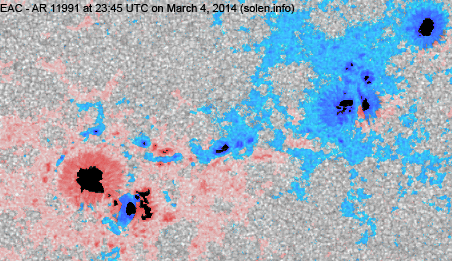
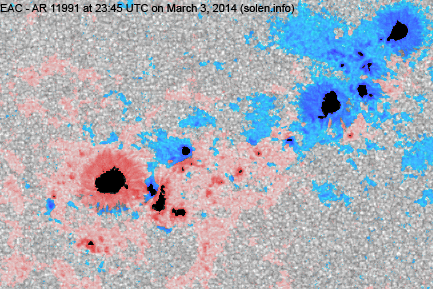
Region 11991 [S25W10] decayed slowly and still has a magnetic delta structure in the
trailing spot section. Further M class flaring is possible.
C5+ flare: C8.3/1F at 04:55 UTC. An M1.0 flare was
recorded at 02:10 UTC on March 5.
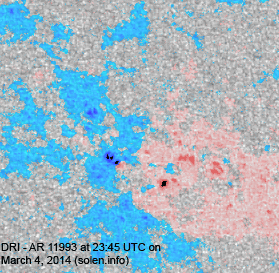
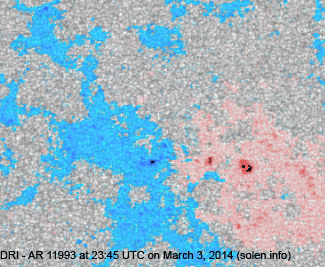
Region 11993 [N17W22] developed slowly and quietly.
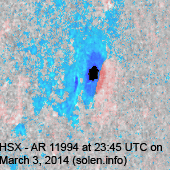
Region 11994 [S07W75] decayed slowly. C5+
flare: long duration C5.6 event peaking at 07:04 UTC.
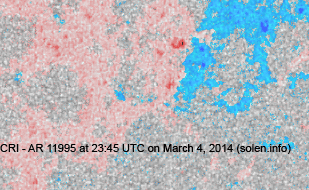
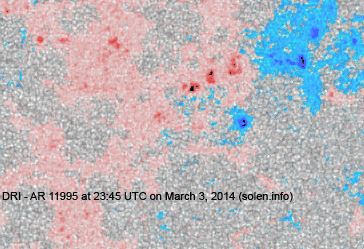
Region 11995 [S17W34] decayed significantly and was quiet.
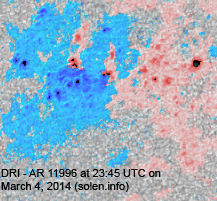
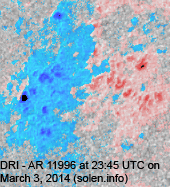
Region 11996 [N13E30] gained spots and was quiet. There's polarity
intermixing and a magnetic delta structure could easily form if the region
develops further.
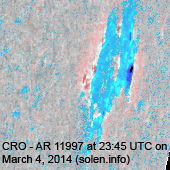
New region 11997 [S12W77] emerged with several spots.
Spotted regions not numbered (or interpreted differently) by SWPC:
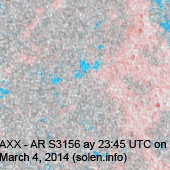
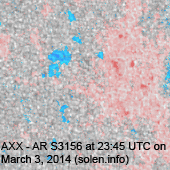
S3156 [N07W49] was quiet and stable.
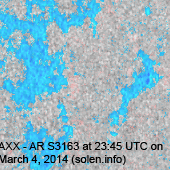
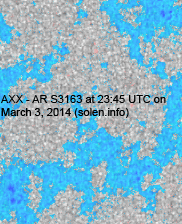
S3163 [S10W53] was quiet and stable.
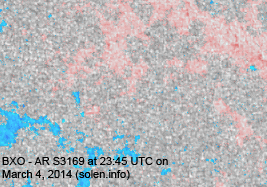
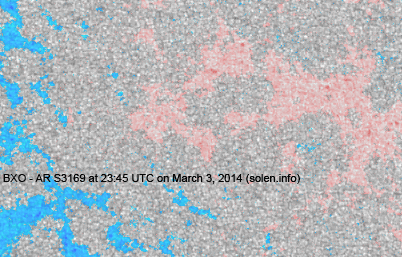
S3169 [N12W37] was quiet and stable.
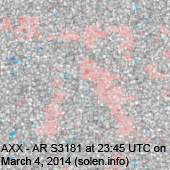
S3181 [S16W06] reemerged with a penumbra spot.
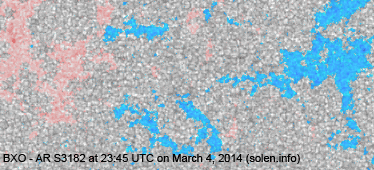
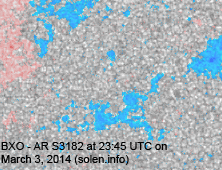
S3182 [S12E03] was quiet and stable.
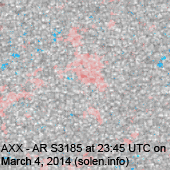
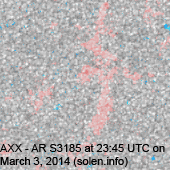
S3185 [N14E02] was quiet and stable.
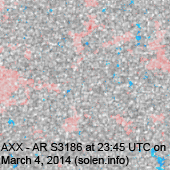
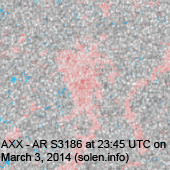
S3186 [N10E13] was quiet and stable.
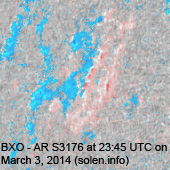
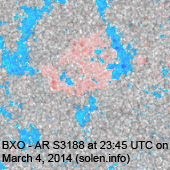
New region S3188 [S17E36] emerged with several
penumbra spots.
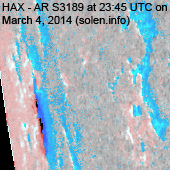
New region S3189 [S10E80] rotated into view.
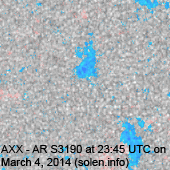
New region S3190 [S06E38] emerged with a penumbra spot.
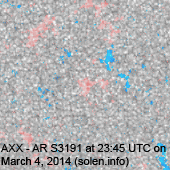
New region S3191 [S24E22] emerged with a penumbra spot.
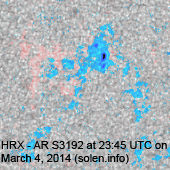
New region S3192 [S22W38] emerged with a few spots.
AR 11986 behind the northwest limb was quite active during the day and produced a number of C flares including C7.6 at 11:24 and a long duration C5.5 event peaking at 18:35 UTC.
March 2-4: No obviously Earth directed CMEs were observed in LASCO and STEREO imagery.
Coronal hole history (since October
2002)
Compare today's report to the situation one solar rotation ago:
28 days ago
27 days ago
26 days ago
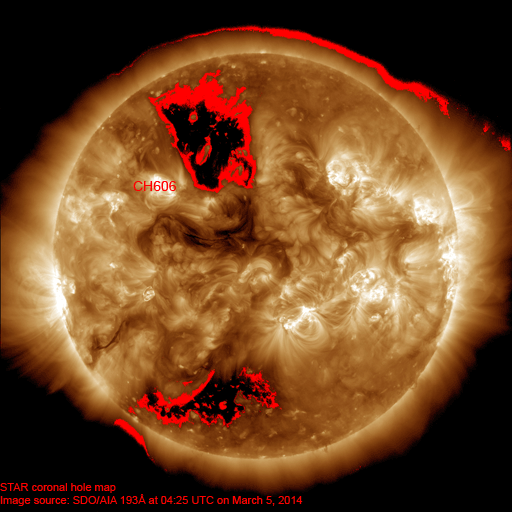
A northern hemisphere coronal hole (CH606) could rotate into an Earth facing position on March 5-6.
Long distance low and medium frequency (below 2 MHz) propagation along paths north of due west over upper middle latitudes is poor to fair. Propagation on long distance northeast-southwest paths is poor.
The geomagnetic field is expected to be mostly quiet on March 5-8. Effects from CH606 could reach Earth on March 9 and cause some unsettled intervals.
| Coronal holes (1) | Coronal mass ejection (2) | M and X class flares (3) |
1) Effects from a coronal hole could reach Earth within the
next 5 days. When the high speed stream has arrived the color changes to
green.
2) Effects from a CME are likely to be observed at Earth within 96 hours.
3) There is a possibility of either M or X class flares within the next 48
hours.
Green: 0-20% probability, Yellow: 20-60% probability, Red: 60-100% probability.
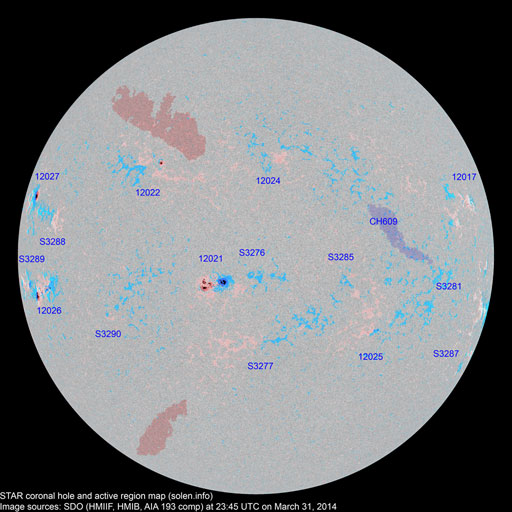
(Click on image for 2K resolution) Compare to the previous day's image. 0.5K image
When available the active region map has a coronal hole polarity overlay where red (pink) is negative and blue is positive.
Data for all numbered solar regions according to the Solar Region Summary provided by NOAA/SWPC. Comments are my own, as is the STAR spot count (spots observed at or inside a few hours before midnight) and data for regions not numbered by SWPC or where SWPC has observed no spots. SWPC active region numbers in the table below and in the active region map above are the historic SWPC/USAF numbers.
| Active region | Date numbered detected |
Spot count | Location at midnight | Area | Classification | SDO / HMI 4K continuum image with magnetic polarity overlay |
Comment | ||||
|---|---|---|---|---|---|---|---|---|---|---|---|
| SWPC | Magnetic (SDO) |
SWPC | STAR | Current | Previous | ||||||
| 2K | 1K | ||||||||||
| 11987 | 2014.02.21 | 1 | 1 | 1 | S01W76 | 0040 | HSX | HSX |
 |
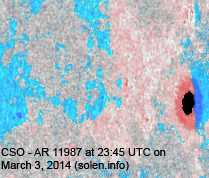 |
area: 0130 location: S02W75 |
| 11989 | 2014.02.22 2014.02.23 |
8 | 16 | 7 | N07W56 | 0070 | CSO | CRI |
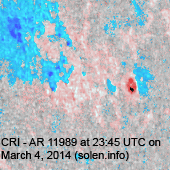 |
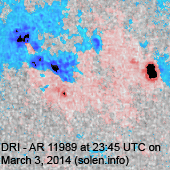 |
area: 0040 |
| 11994 | 2014.02.23 2014.02.28 |
2 | 1 | 1 | S06W75 | 0090 | HSX | HSX |
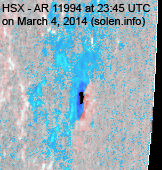 |
 |
area: 0050 |
| S3156 | 2014.02.23 | 3 | 1 | N07W49 | 0010 | AXX |
 |
 |
|||
| 11990 | 2014.02.24 | 6 | 14 | 7 | S12W28 | 0190 | CSO | DHO |
 |
 |
area: 0290 |
| 11991 | 2014.02.25 2014.02.26 |
25 | 48 | 35 | S24W13 | 0240 | EAC | EAC |
 |
 |
beta-gamma-delta area: 0440 location: S25W10 |
| 11992 | 2014.02.25 2014.02.26 |
S19W63 |
 |
plage | |||||||
| S3163 | 2014.02.25 | 2 | S10W53 | 0006 | AXX |
 |
 |
||||
| S3164 | 2014.02.25 | N20W30 |
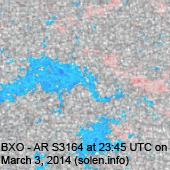 |
plage | |||||||
| 11993 | 2014.02.25 2014.02.26 |
3 | 26 | 12 | N16W23 | 0050 | CSO | DRI |
 |
 |
|
| S3169 | 2014.02.26 | 3 | N12W37 | 0008 | BXO |
 |
 |
||||
| 11995 | 2014.02.28 | 9 | 16 | 11 | S17W34 | 0010 | BXO | CRI |
 |
 |
area: 0040 |
| S3173 | 2014.02.28 | N15W06 | plage | ||||||||
| 11996 | 2014.03.01 2014.03.02 |
14 | 35 | 20 | N13E29 | 0060 | CSI | DRI |
 |
 |
area: 0180 |
| S3176 | 2014.03.02 | N09E45 |
 |
plage | |||||||
| S3177 | 2014.03.02 | N21W03 | plage | ||||||||
| S3180 | 2014.03.02 | S06W23 | plage | ||||||||
| S3181 | 2014.03.02 | 1 | S16W06 |
 |
|||||||
| S3182 | 2014.03.02 | 2 | 2 | S12E03 | 0007 | BXO |
 |
 |
|||
| S3185 | 2014.03.03 | 2 | N14E02 | 0006 | AXX |
 |
 |
||||
| S3186 | 2014.03.03 | 1 | N10E13 | 0003 | AXX |
 |
 |
||||
| 11997 | 2014.03.04 | 2 | 8 | 4 | S13W75 | 0010 | BXO | CRO |
 |
area: 0030 | |
| S3188 | 2014.03.04 | 6 | 2 | S17E36 | 0003 | BXO |
 |
||||
| S3189 | 2014.03.04 | 2 | 2 | S10E80 | 0170 | HAX |
 |
||||
| S3190 | 2014.03.04 | 1 | 1 | S06E38 | 0004 | AXX |
 |
||||
| S3191 | 2014.03.04 | 1 | S24E22 | 0002 | AXX |
 |
|||||
| S3192 | 2014.03.04 | 3 | 2 | S22W38 | 0012 | HRX |
 |
||||
| Total spot count: | 70 | 192 | 108 | ||||||||
| Sunspot number: | 160 | 402 | 258 | (total spot count + 10 * number of spotted regions) | |||||||
| Weighted SN: | 105 | 240 | 156 | (Sum of total spot count + classification weighting for each AR. Classification weighting: X=0, R=3, A/S=5, H/K=10) | |||||||
| Relative sunspot number (Wolf number): | 96 | 141 | 142 | k * (sunspot number). k = 0.6 for SWPC, k = 0.35 for MSN 2K, k = 0.55 for MSN 1K (MSN=Magnetic Sunspot Number) | |||||||
| Month | Average solar flux | International sunspot number (WDC-SILSO) |
Smoothed sunspot number | Average ap (3) |
|
|---|---|---|---|---|---|
| Measured | 1 AU | ||||
| 2012.11 | 121.3 | 118.3 | 61.8 | 59.7 (+1.1) | 7.08 |
| 2012.12 | 108.6 | 105.0 | 40.8 | 59.6 (-0.1) | 3.44 |
| 2013.01 | 127.1 | 123.1 | 62.9 | 58.7 (-0.9) | 4.69 |
| 2013.02 | 104.3 | 101.8 | 38.0 | 58.4 (-0.3) | 6.11 |
| 2013.03 | 111.3 | 110.2 | 57.9 | 57.5 (-0.9) | 10.56 |
| 2013.04 | 124.8 | 125.9 | 72.4 | 57.9 (+0.4) | 5.40 |
| 2013.05 | 131.4 | 134.3 | 78.7 | 59.9 (+2.0) | 9.73 |
| 2013.06 | 110.1 | 113.7 | 52.5 | 62.6 (+2.7) | 12.60 |
| 2013.07 | 115.5 | 119.3 | 57.0 | 65.5 (+2.9) | 9.47 |
| 2013.08 | 114.6 | 118.3 | 66.0 | 69.0 (+3.5) | 8.27 |
| 2013.09 | 102.6 | 103.7 | 36.9 | (72.8 projected, +3.8) | 5.23 |
| 2013.10 | 132.1 | 131.2 | 85.6 | (73.8 projected, +1.0) | 7.71 |
| 2013.11 | 148.3 | 145.1 | 77.6 | (72.7 projected, -1.1) | 5.68 |
| 2013.12 | 147.7 | 143.1 | 90.3 | (71.6 projected, -1.1) | 4.68 |
| 2014.01 | 157.4 | 152.4 | 82.0 | (71.6 projected, 0.0) | 5.44 |
| 2014.02 | 170.3 (cycle peak) |
166.3 | 102.8 (cycle peak) | (70.9 projected, -0.7) | 10.8 |
| 2014.03 | 161.2 (1) | 22.5 (2A) / 174.5 (2B) / 126.0 (2C) | (71.0 projected, +0.1) | (4.8) | |
1) Running average based on the daily 20:00 UTC observed solar flux value at
2800 MHz.
2A) Current impact on the monthly sunspot number based on the Boulder
(NOAA/SWPC) sunspot number (accumulated daily sunspots / month days). The
official WDC-SILSO international sunspot number is typically 30-50% lower. 2B)
Boulder SN current month
average to date. 2C) STAR SDO 1K Wolf number 30 day average.
3) Running average based on the quicklook and definitive Potsdam WDC ap indices.
Values in red are based on the definitive
international
GFZ Potsdam
WDC
ap indices.
This report has been prepared by Jan Alvestad. It is based on the analysis of data from whatever sources are available at the time the report is prepared. All time references are to the UTC day. Comments and suggestions are always welcome.
SDO images are courtesy of NASA/SDO and the AIA, EVE, and HMI science teams.