
Last update December 21, 2002 at 04:30 UTC.
[Solar and geomagnetic data
- last 4 weeks (updated daily)]
[Solar wind and electron
fluence charts (updated daily)]
[Solar cycles 21-23 (last
update December 2, 2002)]
[Solar cycles 1-20]
[Graphical comparison of
cycles 21, 22 and 23 (last update December 2, 2002)]
[Graphical comparison of
cycles 10, 13, 17, 20 and 23 (last update December 2, 2002)]
[Historical solar and geomagnetic
data charts 1954-2002 (last update October 13, 2002)]
[Archived reports (last update December 16, 2002)]
The geomagnetic field was quiet to active on December 20. Solar wind speed ranged between 467 and 556 km/sec under the influence of a coronal stream. Another disturbance began to dominate the solar wind after 18h UTC and the interplanetary magnetic field has been southwards since then, becoming strongly southwards early on Dec.21. The source of the disturbance is likely a CME and may be associated with the full halo CME observed late on December 18.
Solar flare activity was moderate. Solar flux was 196.6, the planetary A
index was 16 (STAR Ap - based on the mean of three hour ap indices: 17.3).
Three hour interval K indices: 33233334 (planetary), 24223333 (Boulder).
The background x-ray flux is at the class B9-C1 level.
At midnight there were 10 spotted regions on the visible disk, 1 of which has not yet been numbered. A total of 13 C and 1 M class flares were recorded during the day.
Region 10223 decayed significantly losing nearly half of its penumbral area.
Region 10224 decayed slowly and was mostly quiet. Flare: C4.2 at 12:53 UTC.
Region 10225 decayed quickly and had only a single small spot left at midnight. Early on Dec.21 the region has become
spotless.
Region 10226 developed in the intermediate spot section early in the day with the magnetic delta becoming stronger. The
region has decayed in the leading and trailing spot section. M class flares are
possible. Flares: C4.5 at 00:37, C1.9 at 08:02, a major impulsive M6.8 flare at 13:18,
C7.2 at 20:14, C1.7 at 23:04, C2.0 at 23:21 UTC and a C1.7 flare which began at 23:58 UTC and peaked at 00:02 on Dec 21.
Region 10227 decayed quickly and will likely become spotless today.
Region 10228 was mostly unchanged and quiet.
Region 10229 decayed early in the day, then a positive polarity area emerged quickly just west of the large trailing
penumbra. Several spots emerged and a magnetic delta structure could be forming in this part of the region. The leading and
intermediate spot sections decayed significantly. An M class flare is possible. Flare: C2.7
at 11:28 UTC.
Region 10230 was mostly unchanged and could still produce a minor M class flare. Flares: C1.4
at 01:45, C1.6 at 05:41, C8.5 at 08:33 and C3.5 at 19:04 UTC.
Region 10231 developed slowly and quietly.
Spotted regions not yet numbered by SEC:
[S58] A new region emerged in the northeast quadrant. Location at midnight: N14E03.
December 18: A full halo CME was observed in LASCO C3 images beginning just before midnight. Its source is not known and may have been backsided.
December 19: A full halo CME was observed in LASCO C3 images from about 08h UTC. The source of this CME is uncertain and may have been backsided. Another full halo CME was observed late in the day after an M2.7 event in region 10229. This CME (which affected a fairly large part of the solar disk, see this EIT 195 difference image) was first observed in LASCO C2 images at 22:06 UTC off of the northwest limb and will likely reach Earth sometime between late on December 21 and early afternoon on December 22. Active to major geomagnetic storm conditions are possible.
December 20: No obviously geoeffective CMEs observed.
Coronal hole history (starting late October 2002)
Compare today's report with the situation one solar rotation ago: 28
days ago
27 days ago 26 days ago
A trans equatorial coronal hole will likely reach a geoeffective position at the central meridian on December 24-25.

Processed SOHO EIT 284 image at 01:06 UTC on December 21. Any black areas on the solar disk are likely coronal holes.
The geomagnetic field is expected to be unsettled to major storm on December 21 and active to major storm on December 22. Quiet to active is expected for December 23. Long distance medium wave (AM) band propagation along east-west paths over high and upper middle latitudes is very poor.
| Coronal holes (1) | Coronal mass ejections (2) | M and X class flares (3) |
1) Effects from a coronal hole could reach Earth within the
next 5 days.
2) Material from a CME is likely to impact Earth within 96 hours.
3) There is a possibility of either M or X class flares within the next 48
hours.
Green: 0-20% probability, Yellow: 20-60% probability, Red: 60-100% probability.
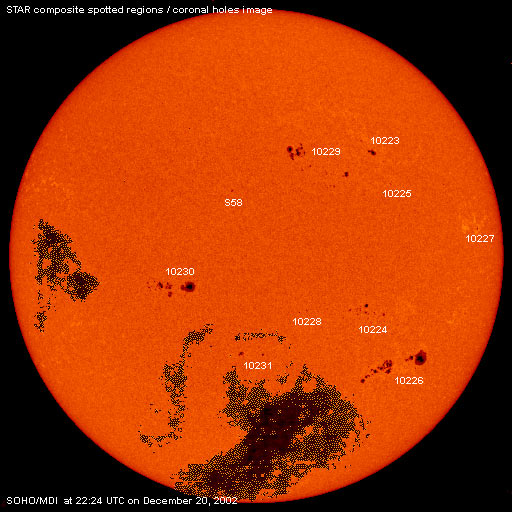
Composite image based on a SOHO/MDI continuum image and overlaid by a coronal hole image. Region numbering has been included. Compare to the previous day image.
Data for all numbered solar regions according to the Solar Region Summary provided by SEC/NOAA. Comments are my own, as is the STAR spot count (spots observed at or inside a few hours before midnight) and data for regions not numbered by SEC or where SEC has observed no spots.
| Solar region | Date numbered | SEC spot count |
STAR spot count |
Location at midnight | Area | Classification | Comment |
|---|---|---|---|---|---|---|---|
| 10223 | 2002.12.12 | 4 | 4 | N25W32 | 0280 | DAO |
area was approx. 0090 at midnight, classification CAO |
| 10224 | 2002.12.12 | 18 | 17 | S14W32 | 0070 | DAO | beta-gamma |
| 10225 | 2002.12.13 | 1 | 1 | N17W33 | 0030 | HSX |
classification was AXX at midnight, area 0000 |
| 10226 | 2002.12.13 | 41 | 29 | S28W41 | 0720 | FKC |
beta-gamma-delta classification was FKI at midnight, area 0500 |
| 10227 | 2002.12.13 | 1 | 1 | N07W63 | 0010 | AXX | |
| 10228 | 2002.12.14 | 2 | 2 | S17W16 | 0010 | BXO | |
| 10229 | 2002.12.14 | 23 | 24 | N19W16 | 0200 | FAO | beta-gamma |
| 10230 | 2002.12.17 | 18 | 23 | S08E19 | 0310 | EKI | beta-gamma |
| 10231 | 2002.12.19 | 5 | 6 | S25E00 | 0020 | DSO |
area was 0040 at midnight, classification DAO |
| S58 | emerged on 2002.12.20 |
1 | N14E03 | 0020 | HRX | ||
| Total spot count: | 113 | 108 | |||||
| SSN: | 203 | 208 | |||||
| Month | Average solar flux at Earth |
International sunspot number | Smoothed sunspot number |
|---|---|---|---|
| 2000.04 | 184.2 | 125.5 | 120.8 cycle 23 sunspot max. |
| 2000.07 | 202.3 | 170.1 | 119.8 |
| 2001.11 | 210.6 | 106.5 | 115.5 (+1.5) |
| 2001.12 | 235.1 | 132.2 | 114.6 (-0.9) |
| 2002.01 | 226.6 | 114.1 | 113.5 (-1.1) |
| 2002.02 | 205.0 | 107.4 | 114.7 (+1.2) |
| 2002.03 | 179.5 | 98.4 | 113.4 (-1.3) |
| 2002.04 | 189.8 | 120.7 | 110.5 (-2.9) |
| 2002.05 | 178.4 | 120.8 | 108.8 (-1.7) |
| 2002.06 | 148.7 | 88.3 | (106.4 predicted, -2.4) |
| 2002.07 | 173.5 | 99.9 | (102.8 predicted, -3.6) |
| 2002.08 | 183.6 | 116.4 | (99.6 predicted, -3.2) |
| 2002.09 | 175.8 | 109.3 | (96.6 predicted, -3.0) |
| 2002.10 | 167.0 | 97.5 | (93.1 predicted, -3.5) |
| 2002.11 | 168.7 | 95.0 | (87.8 predicted, -5.3) |
| 2002.12 | 168.7 (1) | 110.5 (2) | (83.5 predicted, -4.3) |
1) Running average based on the daily 20:00 UT observed solar flux value at 2800
MHz.
2) Unofficial, accumulated value based on the Boulder (SEC/NOAA) sunspot number. The official
international sunspot number is typically 25-45% less.
This report has been prepared by Jan Alvestad. It is based partly on my own observations and interpretations, and partly on data from sources noted in solar links. Comments and suggestions are always welcome.
| [DX-Listeners' Club] [DX News] |