
Last update December 24, 2002 at 04:10 UTC. Minor update posted at 13:38 UTC.
[Solar and geomagnetic data
- last 4 weeks (updated daily)]
[Solar wind and electron
fluence charts (updated daily)]
[Solar cycles 21-23 (last
update December 2, 2002)]
[Solar cycles 1-20]
[Graphical comparison of
cycles 21, 22 and 23 (last update December 2, 2002)]
[Graphical comparison of
cycles 10, 13, 17, 20 and 23 (last update December 2, 2002)]
[Historical solar and geomagnetic
data charts 1954-2002 (last update October 13, 2002)]
[Archived reports (last update December 23, 2002)]
The geomagnetic field was unsettled to minor storm on December 23. Solar wind speed ranged between 456 and 595 km/sec.
Solar flare activity was low. Solar flux was 158.9, the planetary A
index was 26 (STAR Ap - based on the mean of three hour ap indices: 26.4).
Three hour interval K indices: 33455443 (planetary), 33444343 (Boulder).
The background x-ray flux is at the class B6 level.
At midnight there were 7 spotted regions on the visible disk. A total of 8 C class events were recorded during the day.
Region 10223 decayed further and had only a single small spot left by midnight. The region could become spotless today
while rotating to the northwest limb.
Region 10224 developed early in the day, then began to decay fairly quickly and lost its magnetic delta structure. Flares: C1.1
at 12:02 and C1.3 at 12:34 UTC.
Region 10226 decayed slowly. The large leading penumbra rotated out of view at the southwest limb leaving
only a few trailing spots visible. Flares: C1.4 at 04:28 and C3.8 at 07:19 UTC.
Region 10229 decayed slowly and was mostly quiet. Flare: C1.4 at 06:21 UTC.
Region 10230 decayed slowly and quietly.
Region 10231 was mostly unchanged and quiet. Flare: C1.6 at 15:24 UTC.
New region 10233 emerged in the northeast quadrant on Dec.22, then decayed and was spotless most of the day before reemerging during the
evening.
Comment added at 13:38 UTC on December 24: A weak solar wind shock was observed at ACE at 13:!8 UTC. Solar wind speed increased abruptly from 470 to 520 km/sec and the interplanetary magnetic field is currently moderately southwards. Unsettled to minor geomagnetic storm conditions are possible for the remainder of the day.
December 21: A large filament eruption at high latitudes in the northern hemisphere early in the day was associated with a partial halo CME observed off of the northeast and northwest limbs as well as the north pole. This CME is probably not geoeffective.
December 22: A CME was observed off of the northwest limb early in the day after an M1.1 flare and an associated filament eruption in region 10223. The CME does not appear to be geoeffective.
December 23: No obviously geoeffective CMEs observed.
Coronal hole history (since late October 2002)
Compare today's report with the situation one solar rotation ago: 28
days ago
27 days ago 26 days ago
A large and well defined trans equatorial coronal hole will be in a geoeffective position on December 24-25.
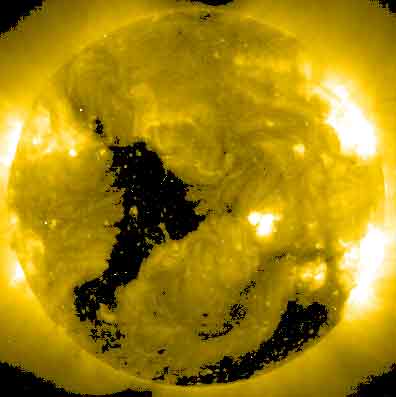
Processed SOHO EIT 284 image at 01:06 UTC on December 24. Any black areas on the solar disk are likely coronal holes.
The geomagnetic field is expected to be quiet to active on December 24 and quiet to unsettled on December 25-26. A coronal stream will likely arrive early on Dec.27 and cause unsettled to minor storm conditions. Long distance medium wave (AM) band propagation along east-west paths over high and upper middle latitudes is very poor.
| Coronal holes (1) | Coronal mass ejections (2) | M and X class flares (3) |
1) Effects from a coronal hole could reach Earth within the
next 5 days.
2) Material from a CME is likely to impact Earth within 96 hours.
3) There is a possibility of either M or X class flares within the next 48
hours.
Green: 0-20% probability, Yellow: 20-60% probability, Red: 60-100% probability.
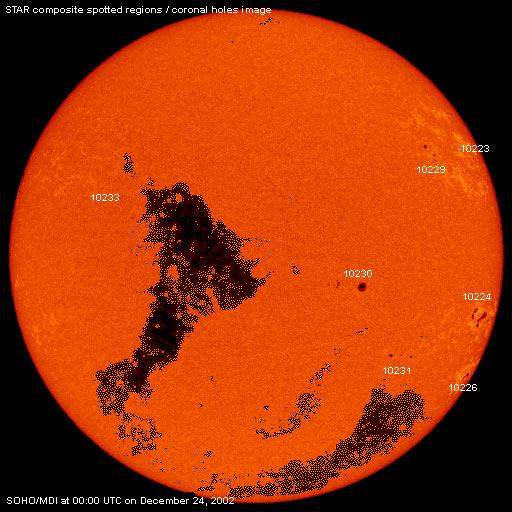
Composite image based on a SOHO/MDI continuum image and overlaid by a coronal hole image. Region numbering has been included. Compare to the previous day image.
Data for all numbered solar regions according to the Solar Region Summary provided by SEC/NOAA. Comments are my own, as is the STAR spot count (spots observed at or inside a few hours before midnight) and data for regions not numbered by SEC or where SEC has observed no spots.
| Solar region | Date numbered | SEC spot count |
STAR spot count |
Location at midnight | Area | Classification | Comment |
|---|---|---|---|---|---|---|---|
| 10223 | 2002.12.12 | 3 | 1 | N22W67 | 0170 | CAO |
classification was AXX at midnight, area 0010 |
| 10224 | 2002.12.12 | 22 | 13 | S15W68 | 0470 | DAO |
beta-gamma area was 0280 at midnight |
| 10225 | 2002.12.13 | 1 | N18W62 | 0000 | AXX |
actually spotless, what did SEC observe? extrapolated position from one day earlier: N17W72 |
|
| 10226 | 2002.12.13 | 13 | 6 | S28W78 | 0460 | FKO |
beta-gamma
classification was DAO at midnight, area 0070 |
| 10228 | 2002.12.14 | S14W52 | plage | ||||
| 10229 | 2002.12.14 | 10 | 5 | N22W51 | 0120 | DAO |
classification was DSO at midnight, area 0070 |
| 10230 | 2002.12.17 | 21 | 10 | S09W21 | 0310 | DHO |
beta-gamma classification was DKO at midnight, area 0250 |
| 10231 | 2002.12.19 | 6 | 5 | S25W39 | 0050 | DAO | |
| 10232 | 2002.12.21 | N13W34 | plage | ||||
| 10233 | 2002.12.23 | 4 | 3 | N11E42 | 0020 | BXO | formerly region S59 |
| Total spot count: | 80 | 43 | |||||
| SSN: | 160 | 113 | |||||
| Month | Average solar flux at Earth |
International sunspot number | Smoothed sunspot number |
|---|---|---|---|
| 2000.04 | 184.2 | 125.5 | 120.8 cycle 23 sunspot max. |
| 2000.07 | 202.3 | 170.1 | 119.8 |
| 2001.11 | 210.6 | 106.5 | 115.5 (+1.5) |
| 2001.12 | 235.1 | 132.2 | 114.6 (-0.9) |
| 2002.01 | 226.6 | 114.1 | 113.5 (-1.1) |
| 2002.02 | 205.0 | 107.4 | 114.7 (+1.2) |
| 2002.03 | 179.5 | 98.4 | 113.4 (-1.3) |
| 2002.04 | 189.8 | 120.7 | 110.5 (-2.9) |
| 2002.05 | 178.4 | 120.8 | 108.8 (-1.7) |
| 2002.06 | 148.7 | 88.3 | (106.4 predicted, -2.4) |
| 2002.07 | 173.5 | 99.9 | (102.8 predicted, -3.6) |
| 2002.08 | 183.6 | 116.4 | (99.6 predicted, -3.2) |
| 2002.09 | 175.8 | 109.3 | (96.6 predicted, -3.0) |
| 2002.10 | 167.0 | 97.5 | (93.1 predicted, -3.5) |
| 2002.11 | 168.7 | 95.0 | (87.8 predicted, -5.3) |
| 2002.12 | 169.1 (1) | 127.5 (2) | (83.5 predicted, -4.3) |
1) Running average based on the daily 20:00 UT observed solar flux value at 2800
MHz.
2) Unofficial, accumulated value based on the Boulder (SEC/NOAA) sunspot number. The official
international sunspot number is typically 25-45% less.
This report has been prepared by Jan Alvestad. It is based partly on my own observations and interpretations, and partly on data from sources noted in solar links. Comments and suggestions are always welcome.
| [DX-Listeners' Club] [DX News] |