
Last update issued on June 11, 2003 at 03:50 UTC. Minor update posted at 16:21 UTC.
[Solar and geomagnetic data - last month (updated daily)]
[Solar wind and electron fluence charts (updated daily)]
[Solar cycles 21-23 (last update June 3, 2003)]
[Solar cycles 1-20]
[Graphical comparison of cycles 21, 22 and 23 (last update June 3, 2003)]
[Graphical comparison of cycles 2, 10, 13, 17, 20 and 23 (last update June 3, 2003)]
[Historical solar and geomagnetic data charts 1954-2003 (last update April 13, 2003)]
[Archived reports (last update June 10, 2003)]
The geomagnetic field was unsettled to major storm on June 10. Solar wind speed ranged between 600 and 764 km/sec under the influence of a high speed stream from coronal hole CH42.
Solar flux measured at 20h UTC on 2.8 GHz was 176.5. The planetary A
index was 27 (STAR Ap - based on the mean of three hour interval ap indices: 27.0).
Three hour interval K indices: 43644443 (planetary), 33554444 (Boulder).
The background x-ray flux is at the class C3 level.
At midnight there were 6 spotted regions on the visible disk. Solar flare activity was high. A total of 7 C, 11 M (new high for a single day during cycle 23) and 1 X class events was recorded during the day. A C7 flare at 15:48 UTC had its source in hot plage near the southeast limb (at a relatively high latitude).
Region 10375 decayed slightly in the trailing spot section where penumbral area decreased. The leading and
intermediate spot sections changed with development occurring some places while loss of spots and penumbral area was observed in
the northern intermediate spot section. Currently there are 3 separate magnetic delta structures with the strongest of them
located in the trailing spots. Further major flaring is highly likely. Flares: C4.2 at 00:32,
C3.0 at 02:14, C3.3 at 02:27, M2.0/1N at 02:54, C3.4 at 06:20, C2.8 at 07:08, M2.7/1N at 08:37, M5.1/2N at 11:12, M2.2/1F long
duration event peaking at 12:52, M2.2 at 14:36, M1.0 at 16:24, M3.9 at 16:30, M5.6 at 18:15, M2.2 at 18:52, M1.0 at 22:13, M2.3 at
23:32 and an impulsive X1.4/2B event beginning at 23:53 and peaking at 00:02 UTC on June 11. The region generated an M7.8 flare at
00:25 UTC on June 11 as well.
Region 10377 was quiet and stable.
Region 10380 developed many new spots during the latter half of the day, particularly in the eastern part of the region.
There is a fairly strong magnetic delta structure within the very large main penumbra. Further development will increase the
potential for a major flare.
Region 10381 developed moderately quickly early in the day, then slowly later on.
New region 10382 emerged in the southwest quadrant.
Spotted regions not yet numbered by NOAA/SEC:
[S182] A new region emerged in the northeast quadrant early on June 10 and developed slowly during the day. Location at midnight:
N20E34.
Comment added at 16:21 UTC on June 11: Region 10375 has been flaring almost continuously today. The region has an extremely hot spot where all activity is taking place. We are waiting for another X flare. The background x-ray flux has been at the class M1 level since 13:15 UTC with peaks at M2.8 at 13:21, M4 at 15:24 and a flare currently in progress at the M3 level. SXI images indicate that a CME was associated with the recent flares.
June 8: No obviously geoeffective CMEs observed.
June 9: A partial halo CME was observed in LASCO images late in the day after the X1 event in region 10375. The major part of the ejected material was observed off of the northwest limb. The CME could reach Earth during the latter half of June 11 and cause major geomagnetic storming.
June 10: A full halo CME was observed in LASCO C3 images before noon. The distribution of the ejected material and lack of supporting frontside activity suggests that the source of this CME was several days behind the east limb. Otherwise slow and continuous mass ejection was observed off of the northwest limb, probably because of the ongoing activity in region 10375. Any CMEs in association with the major flares during the latter half of the day could not be observed as LASCO has shut its doors awaiting a SOHO spacecraft maneuver. No new LASCO images will become available until late on June 13.
Coronal hole history (since late October 2002)
Compare today's report with the situation one solar rotation ago: 28
days ago 27 days ago 26 days ago
A coronal hole (CH43) mainly in the northern hemisphere and with a trans equatorial extension, will rotate into a geoeffective position on June 11-12.
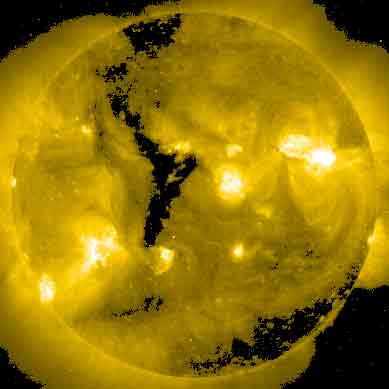
Processed SOHO EIT 284 image at 19:06 UTC on June 10. Any black areas on the solar disk are likely coronal holes.
The geomagnetic field is expected to be unsettled to active for most of June 11. There is a chance of a CME arriving late in the day. In that case activity could increase to major storm levels. On June 14-15 a high speed stream from coronal hole CH43 will likely dominate the solar wind and cause unsettled to active conditions.
Long distance medium wave (AM) band propagation along east-west paths over high and upper middle latitudes is useless and will likely be very poor to useless until at least June 17. Propagation along north-south paths is poor. [Trans Atlantic propagation conditions are currently monitored every night on 1470 kHz. Dominant station tonight: none, only a few unidentified signals heard. Otherwise (on other frequencies) only a few stations from Brazil were noticed.]
| Coronal holes (1) | Coronal mass ejections (2) | M and X class flares (3) |
1) Effects from a coronal hole could reach Earth within the next 5 days.
2) Material from a CME is likely to impact Earth within 96 hours.
3) There is a possibility of either M or X class flares within the next 48 hours.
Green: 0-20% probability, Yellow: 20-60% probability, Red: 60-100% probability.

Compare to the previous day's image.
Data for all numbered solar regions according to the Solar Region Summary provided by NOAA/SEC. Comments are my own, as is the STAR spot count (spots observed at or inside a few hours before midnight) and data for regions not numbered by SEC or where SEC has observed no spots.
| Solar region | Date numbered | SEC spot count |
STAR spot count |
Location at midnight | Area | Classification | Comment |
|---|---|---|---|---|---|---|---|
| 10375 | 2003.06.01 | 65 | 76 | N12W46 | 1200 | FKC | gamma-delta |
| 10377 | 2003.06.04 | 18 | 19 | N04W14 | 0130 | DSO | |
| 10378 | 2003.06.05 | 1 | N15E00 | 0010 | AXX | now spotless | |
| 10380 | 2003.06.07 | 49 | 64 | S15E29 | 0560 | EKI | beta-gamma-delta |
| 10381 | 2003.06.09 | 7 | 14 | S18E07 | 0030 | DSO |
area was 0070 at midnight |
| 10382 | 2003.06.10 | 7 | 9 | S18W16 | 0020 | CAO |
classification was DRO at midnight |
| S176 | emerged on 2003.06.05 |
N14W51 | plage | ||||
| S178 | emerged on 2003.06.06 |
S14W83 | plage | ||||
| S180 | emerged on 2003.06.07 |
S07W25 | plage | ||||
| S181 | emerged on 2003.06.08 |
N15W15 | now spotless | ||||
| S182 | emerged on 2003.06.10 |
4 | N20E34 | 0020 | DRO | ||
| Total spot count: | 147 | 186 | |||||
| SSN: | 207 | 246 | |||||
| Month | Average solar flux at Earth |
International sunspot number | Smoothed sunspot number |
|---|---|---|---|
| 2000.04 | 184.2 | 125.5 | 120.8 cycle 23 sunspot max. |
| 2000.07 | 202.3 | 170.1 | 119.8 |
| 2001.12 | 235.1 | 132.2 | 114.6 (-0.9) |
| 2002.05 | 178.4 | 120.8 | 108.8 (-1.7) |
| 2002.06 | 148.7 | 88.3 | 106.2 (-2.6) |
| 2002.07 | 173.5 | 99.6 | 102.7 (-3.5) |
| 2002.08 | 183.6 | 116.4 | 98.7 (-4.0) |
| 2002.09 | 175.8 | 109.6 | 94.6 (-4.1) |
| 2002.10 | 167.0 | 97.5 | 90.5 (-4.1) |
| 2002.11 | 168.7 | 95.5 | 85.2 (-5.3) |
| 2002.12 | 157.2 | 80.8 | (81.4 predicted, -3.8) |
| 2003.01 | 144.0 | 79.5 | (78.3 predicted, -3.1) |
| 2003.02 | 124.5 | 46.2 | (73.3 predicted, -5.0) |
| 2003.03 | 131.4 | 61.5 | (67.6 predicted, -5.7) |
| 2003.04 | 126.4 | 60.0 | (62.7 predicted, -4.9) |
| 2003.05 | 115.7 | 55.2 | (57.8 predicted, -4.9) |
| 2003.06 | 131.4 (1) | 37.4 (2) | (53.8 predicted, -4.0) |
1) Running average based on the daily 20:00 UTC observed solar flux value at 2800 MHz.
2) Unofficial, accumulated value based on the Boulder (NOAA/SEC) sunspot number. The official international sunspot number is typically
30-50% less.
This report has been prepared by Jan Alvestad. It is based partly on my own observations and interpretations, and partly on data from sources noted in solar links. All time references are to the UTC day. Comments and suggestions are always welcome.
| [DX-Listeners' Club] |