
Last major update issued on March 22, 2005 at 03:10 UTC.
[Solar and
geomagnetic data - last month (updated daily)]
[Solar wind and
electron fluence charts (updated daily)]
[Solar cycles 21-23
(last update March 3, 2005)]
[Solar cycles 1-20]
[Graphical comparison
of cycles 21, 22 and 23 (last update March 3, 2005)]
[Graphical
comparison of cycles 2, 10, 13, 17, 20 and 23 (last update March 3, 2005)]
[Historical solar and
geomagnetic data charts 1954-2004 (last update February 1, 2005)]
[Archived reports
(last update March 16, 2005)]
The geomagnetic field was quiet to active on March 21. Solar wind speed ranged between 293 and 553 km/sec. A solar wind abnormality was observed at ACE after 07h UTC. Until 13h UTC the interplanetary magnetic field was at times moderately southwards and this caused a significant increase in geomagnetic activity. Solar wind speed, having been near 300 km/sec prior to this disturbance, peaked near 09h UTC. A decline in wind speed towards low values were observed for the remainder of the day and early on March 22 wind speed was again near 300 km/sec.
Solar flux measured at 20h UTC on 2.8 GHz was 89.7. The planetary
A
index was 8 (STAR Ap - based on the mean of three hour interval ap
indices: 8.5).
Three hour interval K indices: 11134211 (planetary), 10234322 (Boulder).
The background x-ray flux is at the class A8 level.
At midnight there were 3 spotted regions on the visible solar disk. The solar flare activity level was low. A total of 1 C class event was recorded during the day.
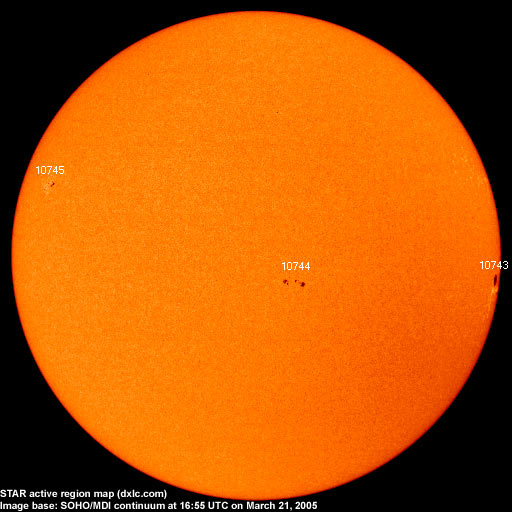
Region 10743 rotated partly out of view at the southwest limb.
Region 10744 did not change significantly and was quiet.
New region 10745 emerged near the northeast limb. There's little or no separation between the opposite polarity areas and
further growth is likely. Further C flares are possible. Flare: C2.7 at 15:47 UTC.
March 19-21: No obvious fully or partly Earth directed CMEs were observed.
Coronal hole
history (since late October 2002)
Compare today's report with the situation one solar rotation ago: 28
days ago 27 days ago 26 days ago
A recurrent trans equatorial coronal hole (CH153) will rotate to a geoeffective position on March 21-23, the westernmost part is only in the northern hemisphere and poorly defined.
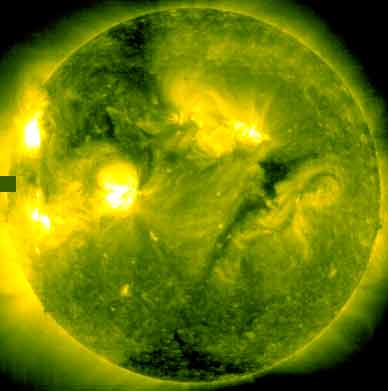
Processed SOHO/EIT 284 image at 13:06 UTC on March 11. The darkest areas on the solar disk are likely coronal holes.
The geomagnetic field is expected to be quiet on March 22-23 becoming quiet to unsettled on March 24 due to effects from CH153. Unsettled to active conditions are likely on March 25-26 as the coronal hole effects increase, occasional minor storm periods are possible.
| Coronal holes (1) | Coronal mass ejections (2) | M and X class flares (3) |
1) Effects from a coronal hole could reach Earth
within the next 5 days. When the high speed stream has arrived
the color changes to green.
2) Material from a CME is likely to impact Earth within 96 hours.
3) There is a possibility of either M or X class flares within the next
48 hours.
Green: 0-20% probability, Yellow: 20-60% probability, Red: 60-100% probability.
Long distance low and medium frequency (below 2 MHz) propagation along east-west paths over high and upper middle latitudes is fair. Propagation along long distance north-south paths is poor. Trans Atlantic propagation conditions are normally monitored every night on 1470 kHz. Dominant stations tonight: WLAM Lewiston ME and Radio Vibraci�n (Venezuela). Several Newfoundland stations were observed with strong signals: 590 VOCM, 640 CBN, 750 CBGY, 800 VOWR and 930 CJYQ. Greenland on 650 kHz was unusually strong as well.
Compare to the previous day's image.
Data for all numbered solar regions according to the Solar Region Summary provided by NOAA/SEC. Comments are my own, as is the STAR spot count (spots observed at or inside a few hours before midnight) and data for regions not numbered by SEC or where SEC has observed no spots. SEC active region numbers in the table below and in the active region map above are the historic SEC/USAF numbers.
| Active region | Date numbered | SEC spot count |
STAR spot count |
Location at midnight | Area | Classification | Comment |
|---|---|---|---|---|---|---|---|
| 10743 | 2005.03.09 | 5 | 2 | S08W84 | 0210 | CSO | classification was HAX at midnight |
| 10744 | 2005.03.20 | 14 | 11 | S12W13 | 0100 | DAO | |
| 10745 | 2005.03.21 | 4 | 8 | N12E54 | 0020 | BXO | classification was CAO at midnight, area 0040 |
| S524 | visible on 2005.03.10 |
N16W79 | plage | ||||
| S525 | emerged on 2005.03.14 |
S13W58 | plage | ||||
| Total spot count: | 23 | 21 | |||||
| SSN: | 53 | 51 | |||||
| Month | Average solar flux at Earth |
International sunspot number | Smoothed sunspot number |
|---|---|---|---|
| 2000.04 | 184.2 | 125.5 | 120.8 cycle 23 sunspot max. |
| 2000.07 | 202.3 | 170.1 | 119.8 |
| 2001.12 | 235.1 | 132.2 | 114.6 (-0.9) |
| 2004.01 | 114.1 | 37.3 | 52.0 (-2.8) |
| 2004.02 | 107.0 | 45.8 | 49.3 (-2.7) |
| 2004.03 | 112.0 | 49.1 | 47.1 (-2.2) |
| 2004.04 | 101.2 | 39.3 | 45.5 (-1.6) |
| 2004.05 | 99.8 | 41.5 | 43.9 (-1.6) |
| 2004.06 | 97.4 | 43.2 | 41.7 (-2.2) |
| 2004.07 | 119.1 | 51.0 | 40.3 (-1.4) |
| 2004.08 | 109.6 | 40.9 | 39.2 (-1.1) |
| 2004.09 | 103.1 | 27.7 | (37.4 predicted, -1.8) |
| 2004.10 | 105.9 | 48.4 | (35.2 predicted, -2.2) |
| 2004.11 | 113.2 | 43.7 | (33.3 predicted, -1.9) |
| 2004.12 | 94.5 | 17.9 | (31.0 predicted, -2.3) |
| 2005.01 | 102.2 | 31.3 | (28.3 predicted, -2.7) |
| 2005.02 | 97.2 | 29.1 | (25.9 predicted, -2.4) |
| 2005.03 | 94.0 (1) | 29.2 (2) | (24.1 predicted, -1.8) |
1) Running average based on the daily 20:00 UTC observed solar flux
value at 2800 MHz.
2) Unofficial, accumulated value based on the Boulder (NOAA/SEC)
sunspot number. The official international sunspot number is typically
30-50% less.
This report has been prepared by Jan Alvestad. It is based partly on my own observations and analysis, and partly on data from some of these solar data sources. All time references are to the UTC day. Comments and suggestions are always welcome.
| [DX-Listeners' Club] |