
Last major update issued on March 26, 2005 at 06:10 UTC.
[Solar and
geomagnetic data - last month (updated daily)]
[Solar wind and
electron fluence charts (updated daily)]
[Solar cycles 21-23
(last update March 3, 2005)]
[Solar cycles 1-20]
[Graphical comparison
of cycles 21, 22 and 23 (last update March 3, 2005)]
[Graphical
comparison of cycles 2, 10, 13, 17, 20 and 23 (last update March 3, 2005)]
[Historical solar and
geomagnetic data charts 1954-2004 (last update February 1, 2005)]
[Archived reports
(last update March 16, 2005)]
The geomagnetic field was quiet to minor storm on March 25. Solar wind speed ranged between 388 and 702 km/sec. The effects from CH153, beginning on March 24, intensified on March 25 as the main part of the high speed stream arrived.
Solar flux measured at 20h UTC on 2.8 GHz was 82.1. The planetary
A
index was 18 (STAR Ap - based on the mean of three hour interval ap
indices: 17.5).
Three hour interval K indices: 14533322 (planetary), 14433323 (Boulder).
The background x-ray flux is at the class A3 level.
At midnight there were 3 spotted regions on the visible solar disk. The solar flare activity level was low. No C class events were recorded during the day.
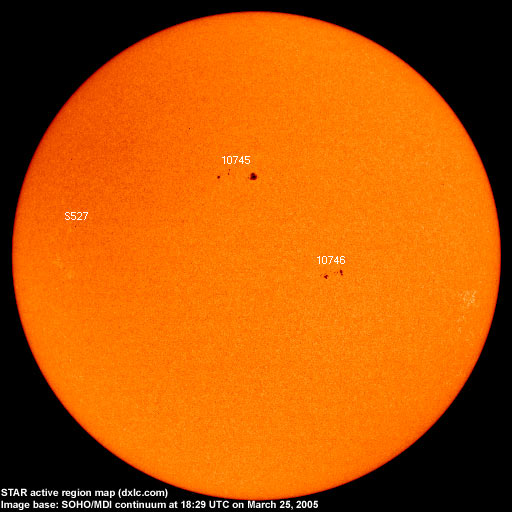
Region 10745 decayed slowly and quietly.
Region 10746 decayed quickly and was quiet.
Spotted regions not numbered by NOAA/SEC:
[S527] This region emerged in the northeast quadrant on March 24. No significant changed were observed on March 25.
Location at midnight: N03E42.
March 23-25: No obvious fully or partly Earth directed CMEs were observed.
Coronal hole
history (since late October 2002)
Compare today's report with the situation one solar rotation ago: 28
days ago 27 days ago 26 days ago
A recurrent trans equatorial coronal hole (CH153) was in an Earth facing position on March 21-23.
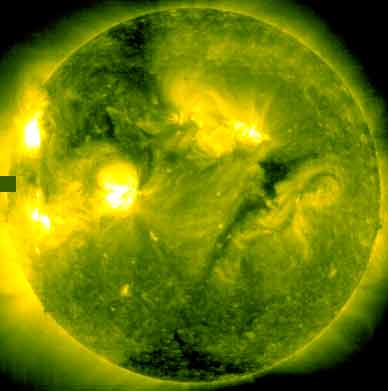
Processed SOHO/EIT 284 image at 13:06 UTC on March 11. The darkest areas on the solar disk are likely coronal holes.
The geomagnetic field is expected to be quiet to active on March 26 due to a high speed stream from CH153. Quiet to unsettled is likely on March 27-28.
| Coronal holes (1) | Coronal mass ejections (2) | M and X class flares (3) |
1) Effects from a coronal hole could reach Earth
within the next 5 days. When the high speed stream has arrived
the color changes to green.
2) Material from a CME is likely to impact Earth within 96 hours.
3) There is a possibility of either M or X class flares within the next
48 hours.
Green: 0-20% probability, Yellow: 20-60% probability, Red: 60-100% probability.
Long distance low and medium frequency (below 2 MHz) propagation along east-west paths over high and upper middle latitudes is poor to fair. Propagation along long distance north-south paths is poor. Trans Atlantic propagation conditions are normally monitored every night on 1470 kHz. Dominant station tonight: Radio Vibraci�n (Venezuela). Quite a few stations from the easternmost parts of North America were noted on other frequencies. VOWR on 800 kHz was the strongest signal at S9+0dB, WTIC Hartford CT on 1080 kHz was well above co-channel stations in Spain.
Compare to the previous day's image.
Data for all numbered solar regions according to the Solar Region Summary provided by NOAA/SEC. Comments are my own, as is the STAR spot count (spots observed at or inside a few hours before midnight) and data for regions not numbered by SEC or where SEC has observed no spots. SEC active region numbers in the table below and in the active region map above are the historic SEC/USAF numbers.
| Active region | Date numbered | SEC spot count |
STAR spot count |
Location at midnight | Area | Classification | Comment |
|---|---|---|---|---|---|---|---|
| 10744 | 2005.03.20 | 2 | S14W68 | 0020 | AXX | spotless | |
| 10745 | 2005.03.21 | 22 | 10 | N12E03 | 0190 | DAI | classification was DAO at midnight, area 0130 |
| 10746 | 2005.03.22 | 11 | 11 | S12W21 | 0080 | DAO | |
| S527 | emerged on 2005.03.24 |
1 | N03E42 | 0010 | AXX | ||
| Total spot count: | 35 | 22 | |||||
| SSN: | 65 | 52 | |||||
| Month | Average solar flux at Earth |
International sunspot number | Smoothed sunspot number |
|---|---|---|---|
| 2000.04 | 184.2 | 125.5 | 120.8 cycle 23 sunspot max. |
| 2000.07 | 202.3 | 170.1 | 119.8 |
| 2001.12 | 235.1 | 132.2 | 114.6 (-0.9) |
| 2004.01 | 114.1 | 37.3 | 52.0 (-2.8) |
| 2004.02 | 107.0 | 45.8 | 49.3 (-2.7) |
| 2004.03 | 112.0 | 49.1 | 47.1 (-2.2) |
| 2004.04 | 101.2 | 39.3 | 45.5 (-1.6) |
| 2004.05 | 99.8 | 41.5 | 43.9 (-1.6) |
| 2004.06 | 97.4 | 43.2 | 41.7 (-2.2) |
| 2004.07 | 119.1 | 51.0 | 40.3 (-1.4) |
| 2004.08 | 109.6 | 40.9 | 39.2 (-1.1) |
| 2004.09 | 103.1 | 27.7 | (37.4 predicted, -1.8) |
| 2004.10 | 105.9 | 48.4 | (35.2 predicted, -2.2) |
| 2004.11 | 113.2 | 43.7 | (33.3 predicted, -1.9) |
| 2004.12 | 94.5 | 17.9 | (31.0 predicted, -2.3) |
| 2005.01 | 102.2 | 31.3 | (28.3 predicted, -2.7) |
| 2005.02 | 97.2 | 29.1 | (25.9 predicted, -2.4) |
| 2005.03 | 92.7 (1) | 36.5 (2) | (24.1 predicted, -1.8) |
1) Running average based on the daily 20:00 UTC observed solar flux
value at 2800 MHz.
2) Unofficial, accumulated value based on the Boulder (NOAA/SEC)
sunspot number. The official international sunspot number is typically
30-50% less.
This report has been prepared by Jan Alvestad. It is based partly on my own observations and analysis, and partly on data from some of these solar data sources. All time references are to the UTC day. Comments and suggestions are always welcome.
| [DX-Listeners' Club] |