Last major update issued on October 27, 2013 at 06:15 UTC.
[Solar and geomagnetic data - last month (updated
daily)]
[Solar wind and
electron fluence charts (updated
daily)]
[Solar cycles 23-24 (last update October 1, 2013)] [Cycle
24 progress (last update October 1, 2013) ]
[Solar cycles 1-20]
[Graphical comparison of cycles 21, 22, 23 and 24 (last
update October 1, 2013)]
[Graphical comparison of cycles 10, 12, 13, 14, 16 and
24 (last update October 1, 2013)]
[Historical solar and geomagnetic data charts 1954-2006
(last update April 5, 2007)]
[Archived reports since January 2003 (last update
October 9, 2013)]
[POES auroral activity level since October
2009 - updated January 26, 2013]
[Solar polar fields vs solar cycles - updated
October 10, 2013]
[Presentation
3rd
SSN Workshop, Tucson, 2013 (pdf)]
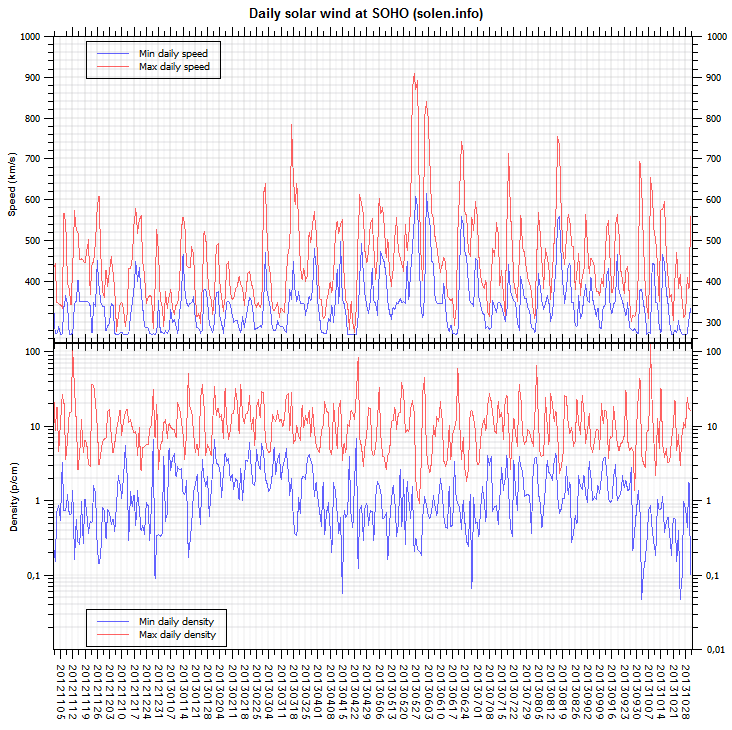
The geomagnetic field was very quiet on October 26. Solar wind speed at SOHO ranged between 270 and 358 km/s. ACE data indicates the arrival of a weak CME near 22h UT, however, the interplanetary magnetic field has been predominantly northwards since then.
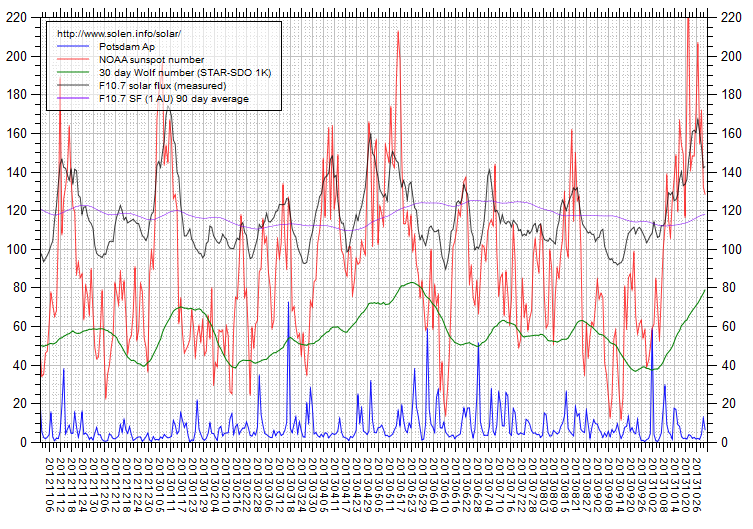
Solar flux measured at 17h UTC on 2.8 GHz was 160.2 (the measurement at 20h was flare enhanced, increasing 57.1 over the last solar rotation). The 90 day 10.7 flux at 1 AU was 116.0. The Potsdam WDC planetary A index was 2 (STAR Ap - based on the mean of three hour interval ap indices: 1.5). Three hour interval K indices: 00000001 (planetary), 10001211 (Boulder).
The background x-ray flux was at the class C1 level.
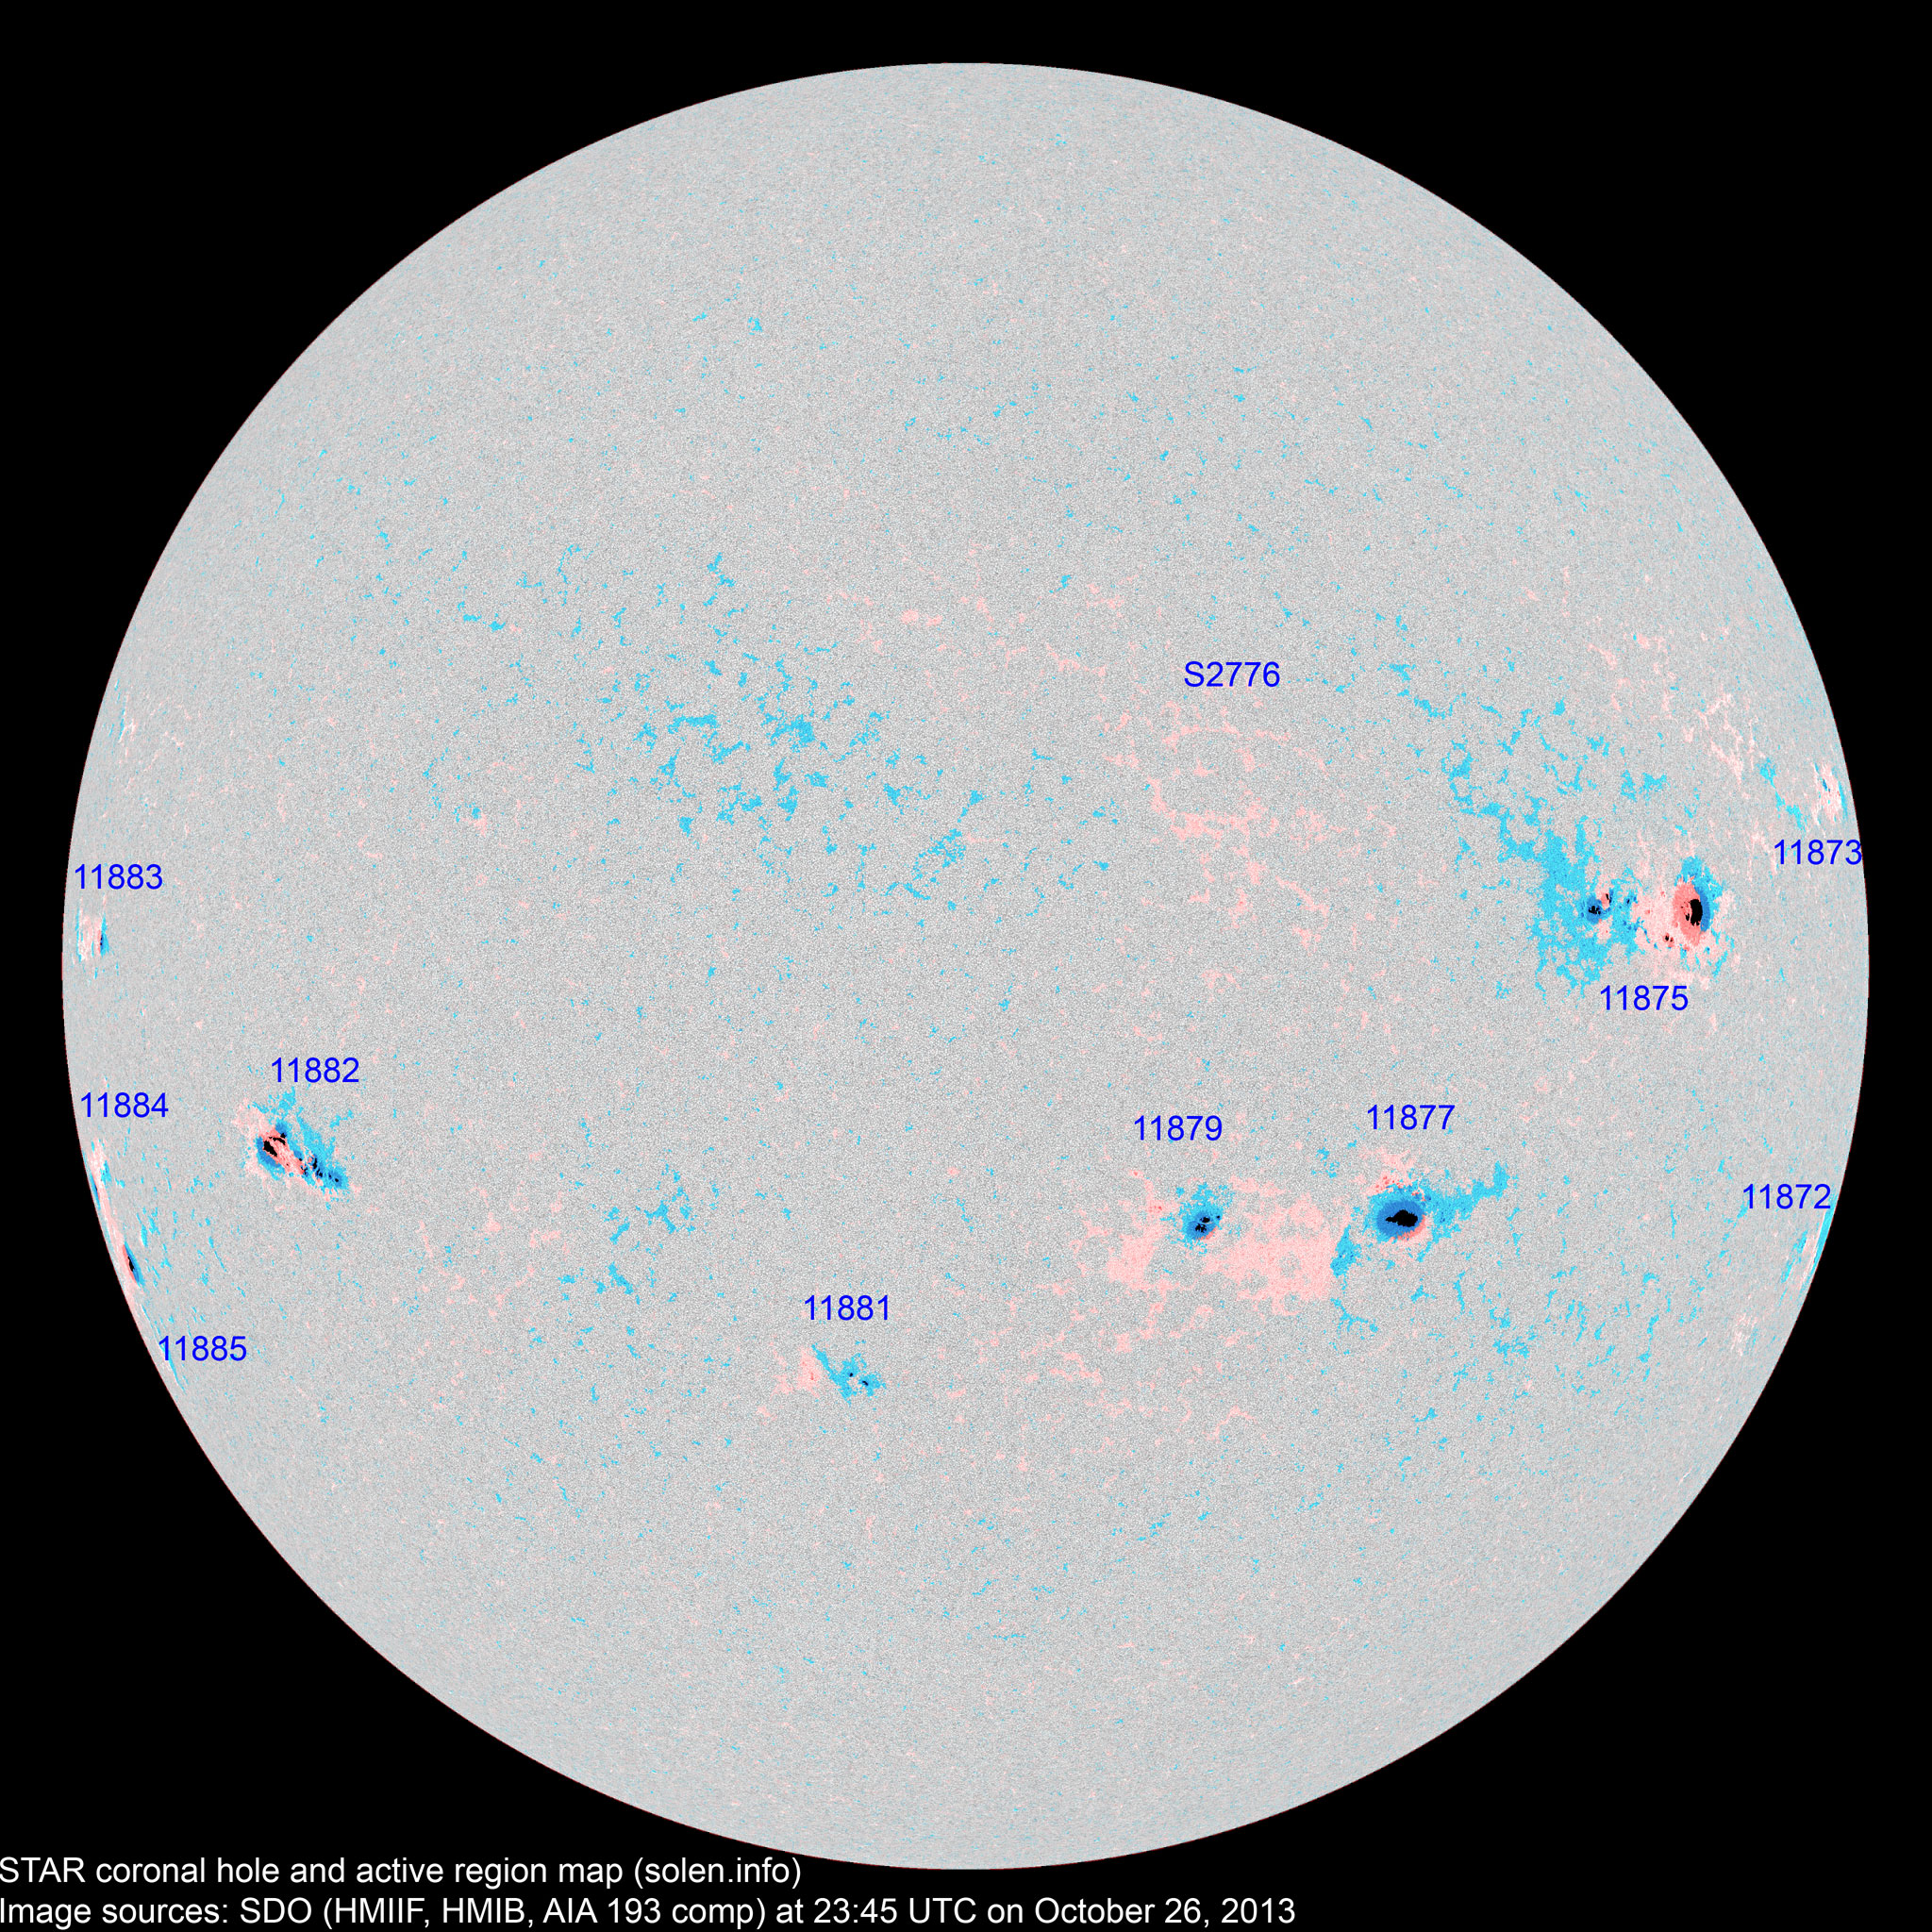
At the time of counting spots (see image time) spots were observed in 11 active regions in 2K resolution (SN: 228) and 10 active regions in 1K resolution (SN: 169) SDO images on the visible solar disk.
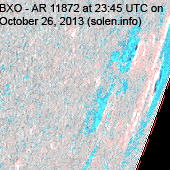
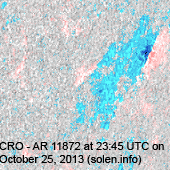
Region 11872 [S18W78] was quiet and stable.
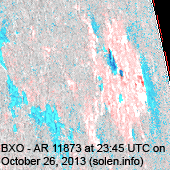
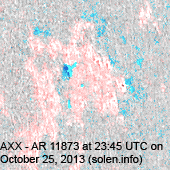
Region 11873 [N12W80] developed slowly and was
quiet.
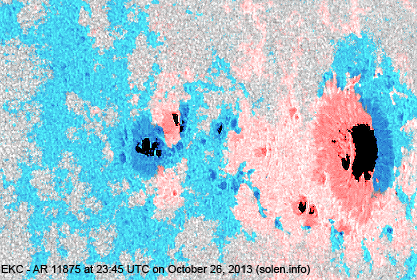
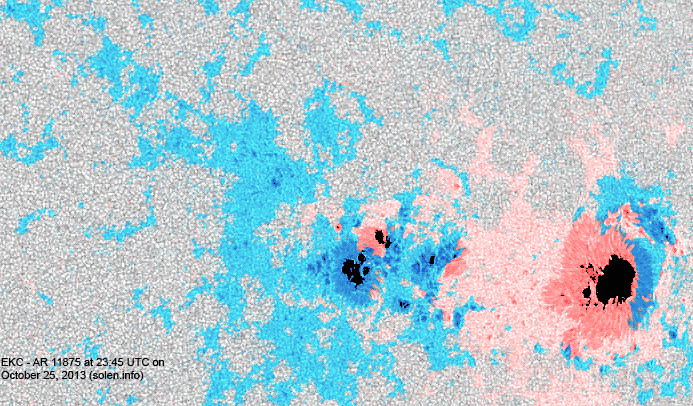
Region 11875 [N06W52] decayed slowly and has a magnetic delta structure in the trailing
spot section. M class flares are possible.
C5+ flares: M1.2 at 09:23 (not reported by SWPC) UTC.
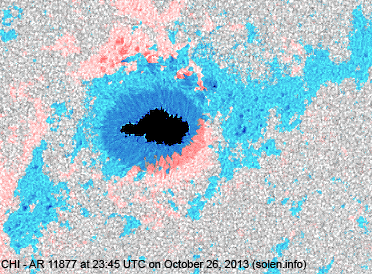
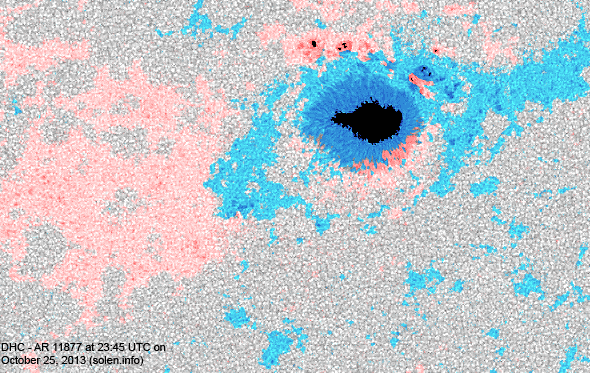
Region 11877 [S12W29] lost negative polarity umbrae but still has
polarity intermixing.
C5+ flares: C5.2 at 08:46, C8.8 at 17:15, C7.7 at 19:20
UTC.
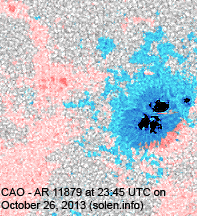
Region 11879 [S12W14] decayed in the trailing spot section.
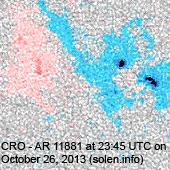
Region 11881 [S22E08] was quiet and stable.
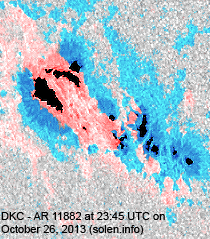
Region 11882 [S09E49] produced several M class flares and has at least
two magnetic delta structures. Major flaring is possible.
C5+ flares: M2.3/1B at 06:06, M1.5 at 09:37,
M1.8/1N long duration event peaking at 11:08 (associated with a partial halo CME),
C6.5 at 17:32, M1.0 at 19:53 UTC.
New region 11883 [N02E75] rotated into view.
New region 11884 [S12E80] rotated into view. It is not yet clear whether
this and AR 11885 are tow independent groups or one group. M flares are possible.
C5+ flares: M3.1 at 19:27 UTC.
New region 11885 [S18E77] rotated into view.
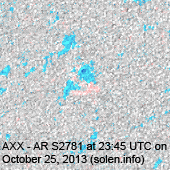
Spotted regions not numbered by SWPC:
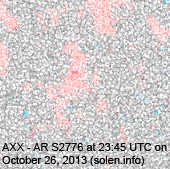
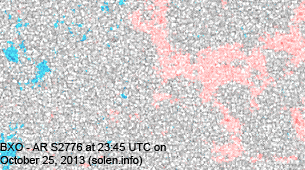
S2776 [N08W18] lost the trailing spots.
October 24: A faint halo CME was observed after the M9 event in AR 11877
early in the day.
October 25: A faint asymmetric halo CME was observed after the X1.7 event
at 08h while a significantly larger full halo asymmetric CME was observed after
the X2.1 flare near 15h. The latter CME will likely reach Earth on October 27.
October 26: An asymmetric halo CME was observed after the M1.8 LDE near
11h. Due to many other CMEs it is difficult to determine if this one was full or
partial halo. The CME could reach Earth on October 29.
Coronal hole history (since October
2002)
Compare today's report to the situation one solar rotation ago:
28 days ago
27 days ago
26 days ago
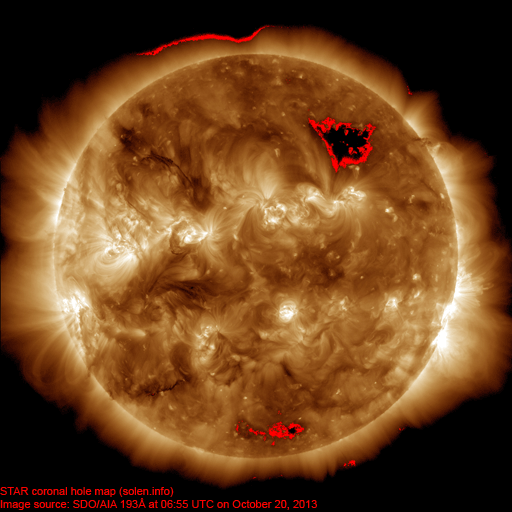
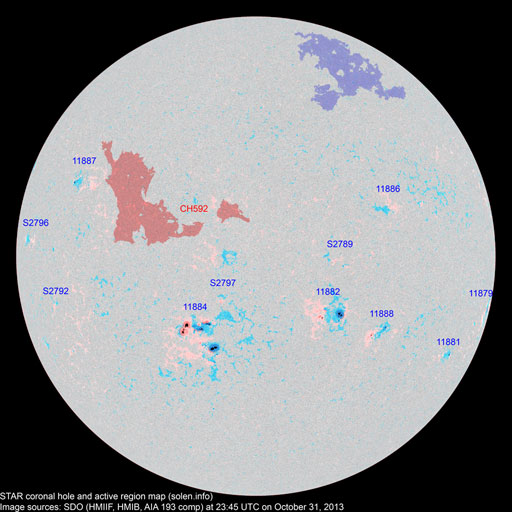
No obvious coronal holes are currently in or near Earth facing positions.
Long distance low and medium frequency (below 2 MHz) propagation along paths north of due west over high and upper middle latitudes is good. Propagation on long distance northeast-southwest paths is poor.
The geomagnetic field is expected to be quiet to minor storm on October 27-29 due to CME effects, occasional major storm intervals are possible when the CME observed after the X2 event on Oct.25 arrives.
| Coronal holes (1) | Coronal mass ejection (2) | M and X class flares (3) |
1) Effects from a coronal hole could reach Earth within the
next 5 days. When the high speed stream has arrived the color changes to
green.
2) Effects from a CME are likely to be observed at Earth within 96 hours.
3) There is a possibility of either M or X class flares within the next 48
hours.
Green: 0-20% probability, Yellow: 20-60% probability, Red: 60-100% probability.
(Click on image for 2K resolution) Compare to the previous day's image. 0.5K image
When available the active region map has a coronal hole polarity overlay where red (pink) is negative and blue is positive.
Data for all numbered solar regions according to the Solar Region Summary provided by NOAA/SWPC. Comments are my own, as is the STAR spot count (spots observed at or inside a few hours before midnight) and data for regions not numbered by SWPC or where SWPC has observed no spots. SWPC active region numbers in the table below and in the active region map above are the historic SWPC/USAF numbers.
| Active region | Date numbered detected |
Spot count | Location at midnight | Area | Classification | SDO / HMI 4K continuum image with magnetic polarity overlay |
Comment | ||||
|---|---|---|---|---|---|---|---|---|---|---|---|
| SWPC | STAR SDO | SWPC | STAR | Current | Previous | ||||||
| 2K | 1K | ||||||||||
| 11872 | 2013.10.14 2013.10.15 |
2 | 3 | S18W80 | 0010 | BXO | BXO |
 |
 |
||
| 11873 | 2013.10.14 2013.10.16 |
5 | 3 | N11W75 | 0020 | BXO |
 |
 |
|||
| 11875 | 2013.10.16 2013.10.17 |
38 | 37 | 23 | N07W51 | 0660 | EKC | EKC |
 |
 |
beta-gamma-delta area: 0900 |
| 11877 | 2013.10.18 | 15 | 29 | 15 | S12W30 | 0320 | CHI | CHI |
 |
 |
beta-gamma |
| S2769 | 2013.10.18 | N18W48 | plage | ||||||||
| 11879 | 2013.10.21 | 6 | 9 | 5 | S12W15 | 0100 | CAO | CAO |
 |
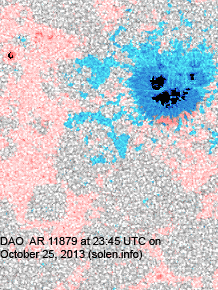 |
area: 0140 |
| 11880 | 2013.10.21 | N12W86 | plage | ||||||||
| S2774 | 2013.10.22 | S16W85 |
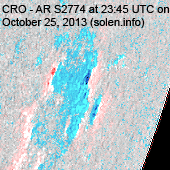 |
plage | |||||||
| 11881 | 2013.10.22 2013.10.24 |
4 | 6 | 5 | S22E08 | 0010 | BXO | CRO |
 |
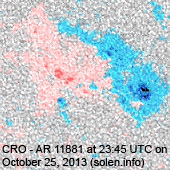 |
area: 0030 |
| S2776 | 2013.10.22 | 1 | 1 | N08W18 | 0004 | AXX |
 |
 |
|||
| S2777 | 2013.10.22 | N35W20 | plage | ||||||||
| 11882 | 2013.10.23 2013.10.24 |
11 | 19 | 12 | S08E47 | 0300 | DKI | DKC |
 |
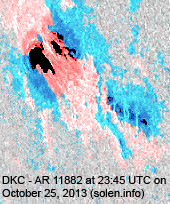 |
area: 0500 |
| S2779 | 2013.10.23 | S20W50 | plage | ||||||||
| S2780 | 2013.10.24 | S10E20 | plage | ||||||||
| S2781 | 2013.10.25 | N26E35 |
 |
plage | |||||||
| 11883 | 2013.10.26 | 2 | 2 | 2 | N04E74 | 0040 | HAX | HAX |
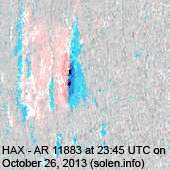 |
location: N02E75 | |
| 11884 | 2013.10.26 | 2 | 6 | 2 | S09E78 | 0050 | HAX | CAO |
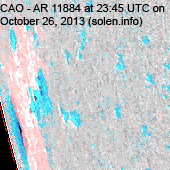 |
area: 0100 location: S12E80 |
|
| 11885 | 2013.10.26 | 1 | 1 | 1 | S17E75 | 0070 | HSX | HHX |
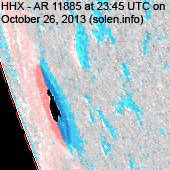 |
area: 0260 location: S18E77 |
|
| Total spot count: | 81 | 118 | 69 | ||||||||
| Sunspot number: | 171 | 228 | 169 | (total spot count + 10 * number of spotted regions) | |||||||
| Weighted SN: | 131 | 176 | 127 | (Sum of total spot count + classification weighting for each AR. Classification weighting: X=0, R=3, A/S=5, H/K=10) | |||||||
| Relative sunspot number (Wolf number): | 103 | 80 | 93 | k * (sunspot number). k = 0.6 for SWPC, k = 0.35 for STAR SDO 2K, k = 0.55 for STAR SDO 1K | |||||||
| Month | Average measured solar flux | International sunspot number (SIDC) | Smoothed sunspot number | Average ap (3) |
|---|---|---|---|---|
| 2011.11 | 153.5 (cycle peak) | 96.7 (cycle peak) | 61.1 (+1.2) | 5.55 |
| 2012.02 | 106.5 | 32.9 | 66.9 (+1.4) likely cycle 24 max |
8.81 |
| 2012.06 | 119.6 | 64.5 | 58.9 (-2.8) | 10.08 |
| 2012.07 | 133.9 | 66.5 | 57.8 (-1.1) | 13.90 |
| 2012.08 | 115.4 | 63.0 | 58.2 (+0.4) | 7.96 |
| 2012.09 | 122.9 | 61.4 | 58.1 (-0.1) | 8.07 |
| 2012.10 | 123.3 | 53.3 | 58.6 (+0.5) | 9.97 |
| 2012.11 | 121.3 | 61.8 | 59.7 (+1.1) | 7.08 |
| 2012.12 | 108.6 | 40.8 | 59.6 (-0.1) | 3.44 |
| 2013.01 | 127.1 | 62.9 | 58.7 (-0.9) | 4.69 |
| 2013.02 | 104.3 | 38.0 | 58.4 (-0.3) | 6.11 |
| 2013.03 | 111.3 | 57.9 | 57.5 (-0.9) | 10.56 |
| 2013.04 | 124.8 | 72.4 | (56.2 projected, -1.3) | 5.40 |
| 2013.05 | 131.4 | 78.7 | (55.8 projected, -0.4) | 9.73 |
| 2013.06 | 110.1 | 52.5 | (56.0 projected, +0.2) | 12.60 |
| 2013.07 | 115.5 | 57.0 | (56.1 projected, +0.1) | 9.47 |
| 2013.08 | 114.6 | 66.0 | (55.9 projected, -0.2) | 8.27 |
| 2013.09 | 102.6 | 36.9 | (55.4 projected, -0.5) | 5.23 |
| 2013.10 | 128.1 (1) | 101.6 (2A) / 121.2 (2B) / 70.6 (2C) | (53.9 projected, -1.5) | (8.13) |
1) Running average based on the daily 20:00 UTC observed solar flux value at
2800 MHz.
2A) Current impact on the monthly sunspot number based on the Boulder
(NOAA/SWPC) sunspot number (accumulated daily sunspots / month days). The
official SIDC international sunspot number is typically 30-50% lower. 2B)
Boulder SN current month
average to date. 2C) STAR SDO 1K Wolf number 30 day average.
3) Running average based on the quicklook and definitive Potsdam WDC ap indices.
Values in red are based on the definitive
international Potsdam
WDC
ap indices.
This report has been prepared by Jan Alvestad. It is based on the analysis of data from whatever sources are available at the time the report is prepared. All time references are to the UTC day. Comments and suggestions are always welcome.
SDO images are courtesy of NASA/SDO and the AIA, EVE, and HMI science teams.