
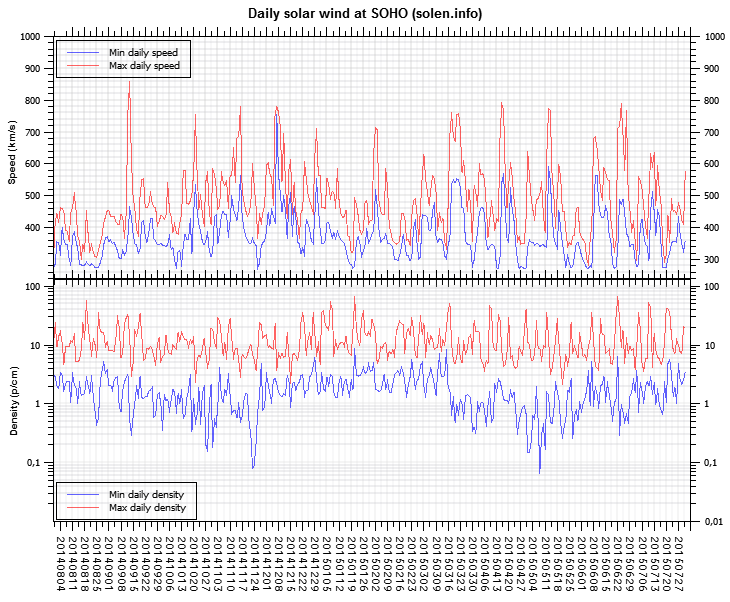
The geomagnetic field was quiet on July 7. Solar wind speed at SOHO ranged between 378 and 463 km/s.
Solar flux at 20h UTC on 2.8 GHz was 132.6 (decreasing 2.8 over the last solar rotation). The 90 day 10.7 flux at 1 AU was 126.7. The Potsdam WDC planetary A index was 4 (STAR Ap - based on the mean of three hour interval ap indices: 4.1). Three hour interval K indices: 20111112 (planetary), 31122212 (Boulder).
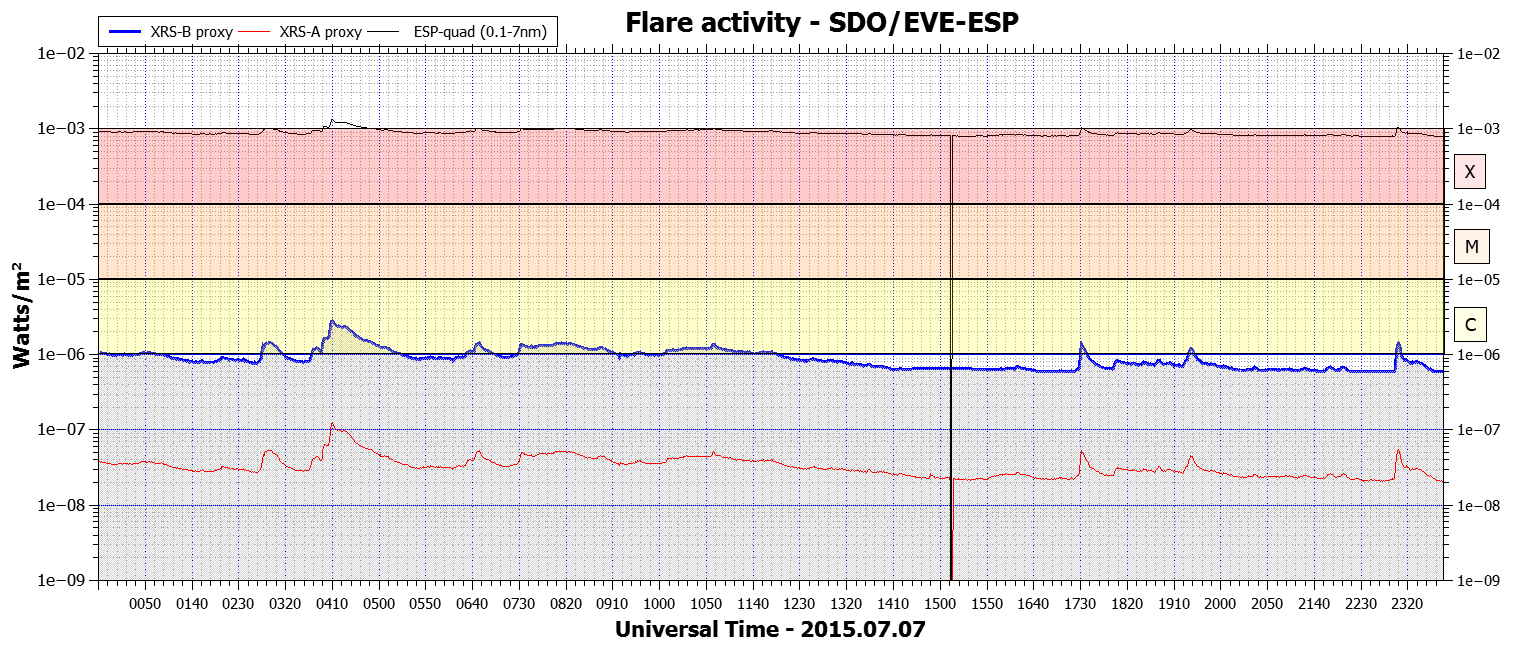
The background x-ray flux is at the class B5 level.
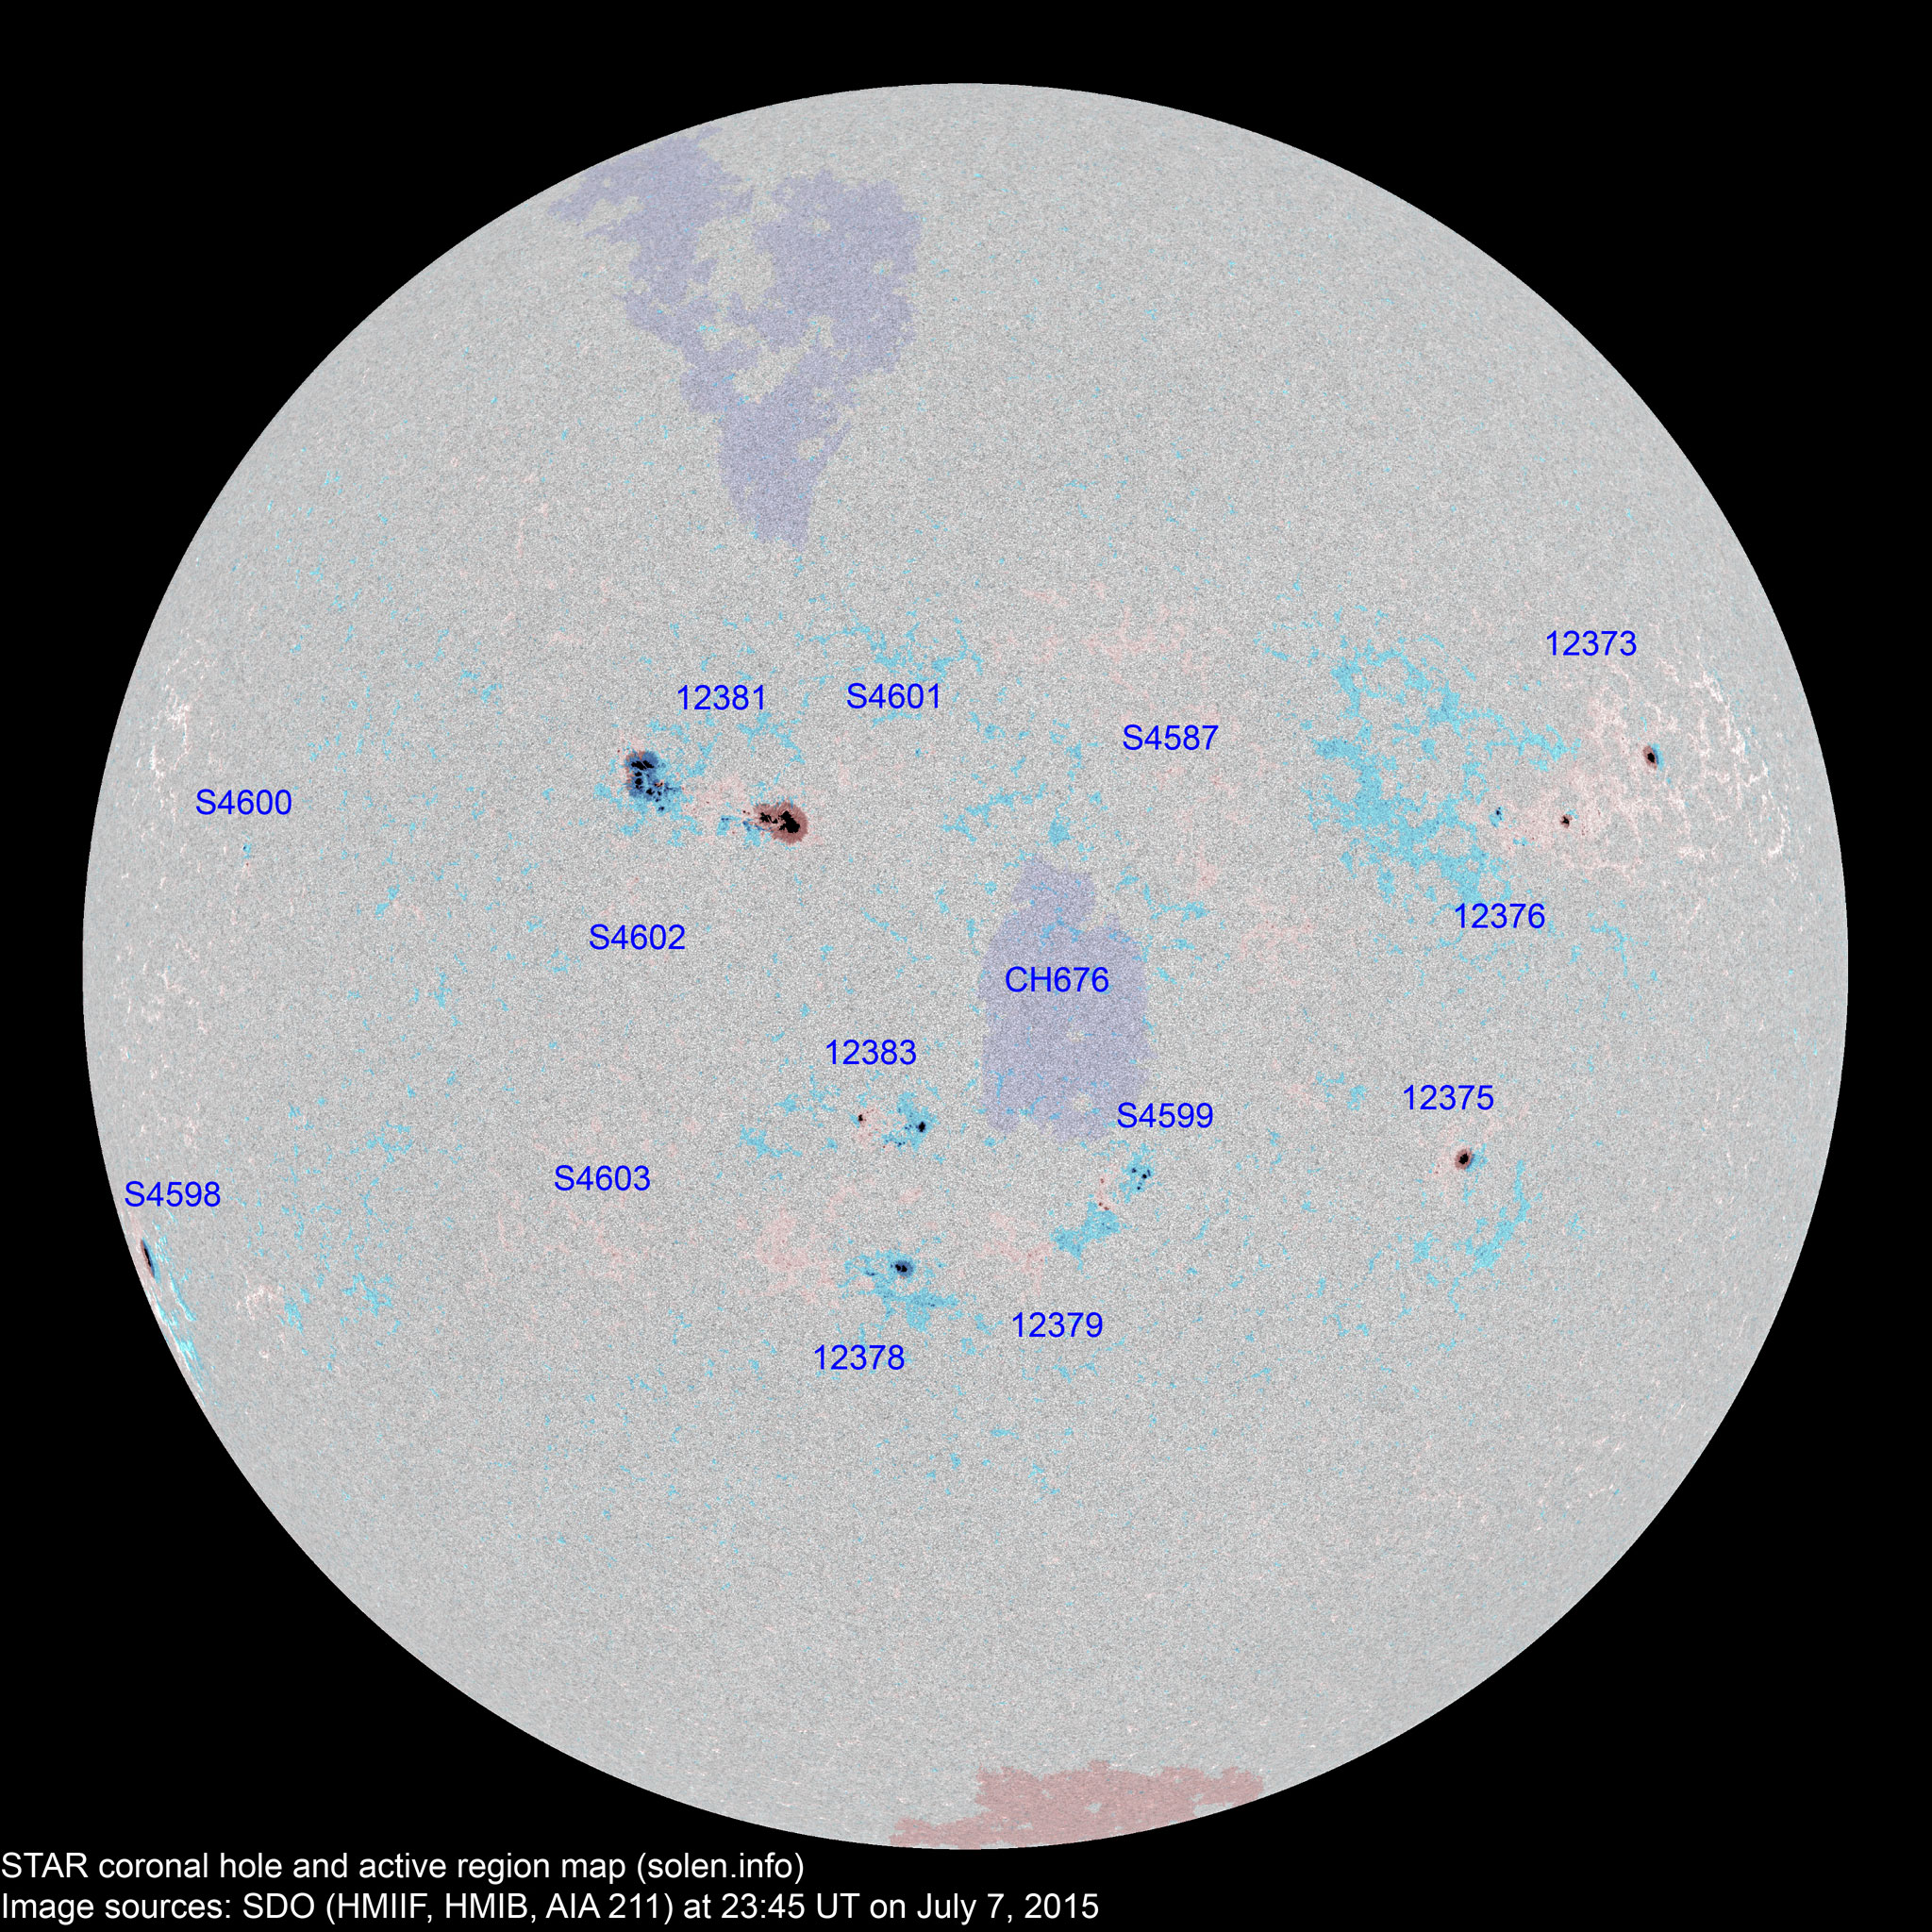
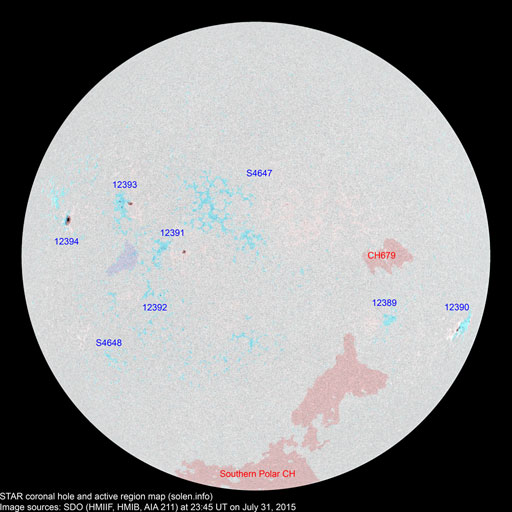
At the time of counting spots (see image time), spots were observed in 14 active regions using 2K resolution (SN: 283) and 14 active regions using 1K resolution (SN: 218) SDO images on the visible solar disk.
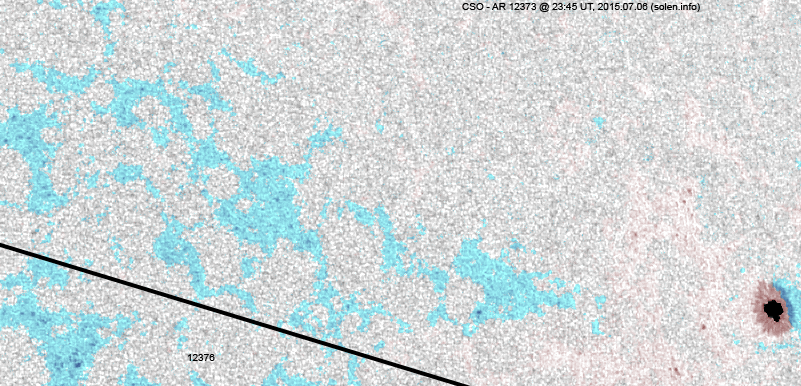
Region 12373 [N16W53] decayed slowly and quietly.
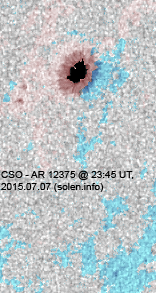
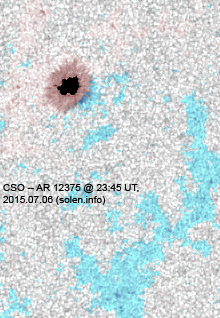
Region 12375 [S10W35] was quiet and stable.
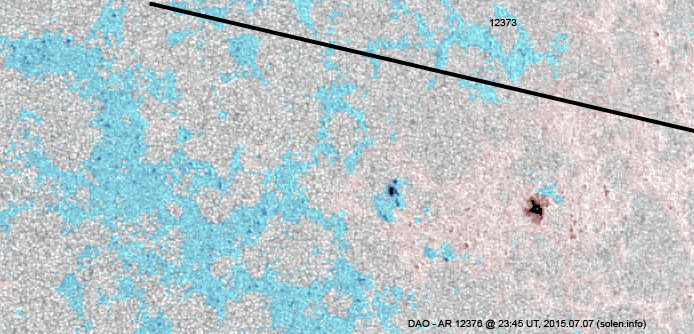
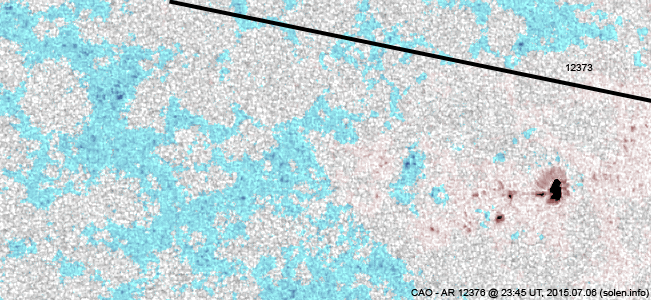
Region 12376 [N12W42] decayed slowly and quietly.
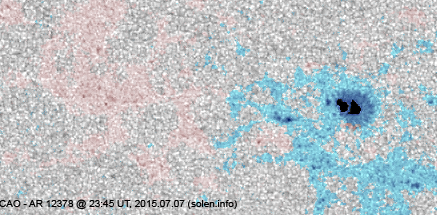
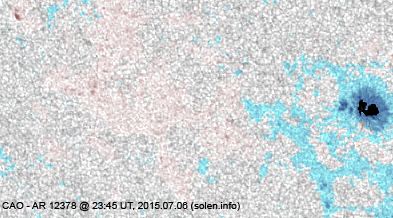
Region 12378 [S17E05] was quiet and stable.
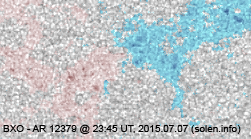
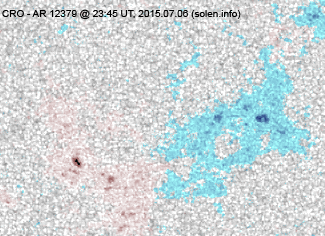
Region 12379 [S14W07] decayed slowly and quietly.
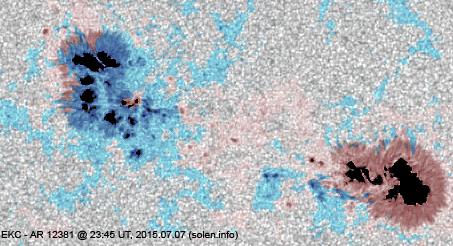
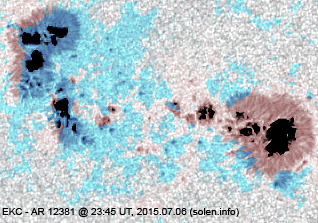
Region 12381 [N14E17] matured somewhat as the largest areas of positive
and negative magnetic polarity drifted apart. A small magnetic delta formed in
the trailing spot section.
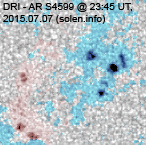
New region 12383 [S07E05] emerged on July 6 and was numbered by SWPC the
next day.
Spotted regions not numbered (or interpreted differently) by SWPC:
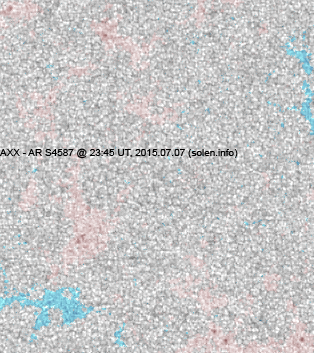
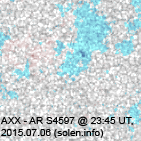
S4587 [N09W17] was quiet and stable.
New region S4598 [S19E78] rotated into view with a large symmetrical
spot.
New region S4599 [S11W10] emerged with several spots immediately to the
northwest of AR 12379.
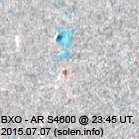
New region S4600 [N09E56] emerged with penumbra spots.
New region S4601 [N17E03] emerged with a penumbra spot.
New region S4602 [N09E22] emerged with a penumbra spot.
New region S4603 [S16E25] was observed with a penumbra spot.
C2+ flares:
| Magnitude | Peak time (UTC) | Location | AR | Recorded by | Comment |
| C2.7/1F | 03:47 | N14E32 | 12381 | GOES15 |
July 5-7: No obviously Earth directed CMEs were observed.
[Coronal hole
history (since October 2002)]
[Compare today's report to the situation one solar rotation ago:
28 days ago
27 days ago
26 days ago]
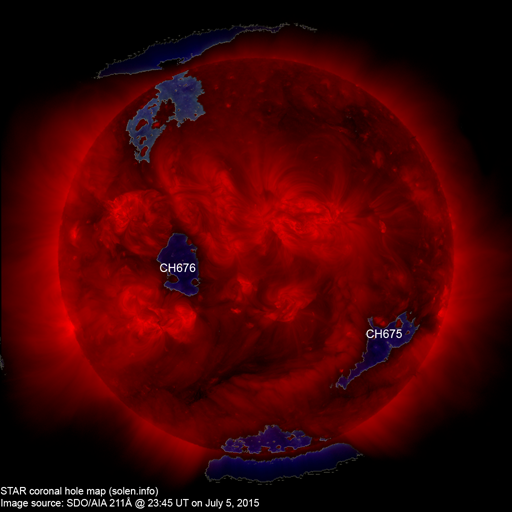
A recurrent trans equatorial coronal hole (CH676) will rotate into an Earth facing position on July 7-8.
Long distance low and medium frequency (below 2 MHz) propagation along paths north of due west over upper middle latitudes is poor. Propagation on long distance northeast-southwest paths is poor.
The geomagnetic field is expected to be quiet on July 8-9. Effects from CH676 could cause some unsettled and active intervals on July 10-11.
| Coronal holes (1) | Coronal mass ejection (2) | M and X class flares (3) |
1) Effects from a coronal hole could reach Earth within the
next 5 days. When the high speed stream has arrived the color changes to green.
2) Effects from a CME are likely to be observed at Earth within 96 hours.
3) There is a possibility of either M or X class flares within the next 48
hours.
Green: 0-30% probability, Yellow: 30-70% probability, Red: 70-100% probability.
(Click on image for 2K resolution)
Compare to the previous day's image.
When available the active region map has a coronal hole polarity overlay where red (pink) is negative and blue is positive.
Data for all numbered solar regions according to the Solar Region Summary provided by NOAA/SWPC. Comments are my own, as is the STAR spot count (spots observed at or inside a few hours before midnight) and data for regions not numbered by SWPC or where SWPC has observed no spots. SWPC active region numbers in the table below and in the active region map above are the historic SWPC/USAF numbers.
| Active region | Date numbered detected |
Spot count | Location at midnight | Area | Classification | SDO / HMI 4K continuum image with magnetic polarity overlays |
Comment | ||||
|---|---|---|---|---|---|---|---|---|---|---|---|
| SWPC | Magnetic (SDO) |
SWPC | STAR | Current | Previous | ||||||
| 2K | 1K | ||||||||||
| 12373 | 2015.06.27 2015.06.28 |
1 | 5 | 3 | N16W55 | 0050 | HSX | HSX |
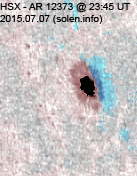 |
images/AR_12373_20150706_2345.png |
|
| 12376 | 2015.06.28 2015.06.30 |
8 | 31 | 11 | N12W38 | 0060 | CAO | DAO |
 |
 |
|
| 12375 | 2015.06.28 2015.06.29 |
1 | 5 | 4 | S10W36 | 0050 | HSX | CSO |
 |
 |
|
| 12379 | 2015.07.01 2015.07.03 |
7 | 9 | 4 | S13W07 | 0020 | CRO | BXO |
 |
 |
|
| 12378 | 2015.07.01 2015.07.02 |
3 | 17 | 5 | S17E03 | 0050 | HSX | CAO |
 |
 |
|
| S4587 | 2015.07.02 | 7 | 4 | N09W17 | 0015 | AXX |
 |
 |
|||
| 12381 | 2015.07.03 2015.07.04 |
25 | 40 | 26 | N14E17 | 0450 | EKC | EKC |
 |
 |
beta-gamma-delta area: 0900 |
| S4590 | 2015.07.03 | N23W05 |
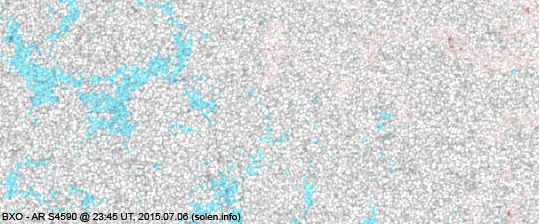 |
||||||||
| 12380 | 2015.07.03 2015.07.04 |
N09W70 | |||||||||
| 12382 | 2015.07.04 2015.07.05 |
S05W28 | spotless | ||||||||
| S4594 | 2015.07.04 | N07E41 | |||||||||
| 12383 | 2015.07.06 2015.07.07 |
3 | 15 | 8 | S06E04 | 0020 | DRO | DRI |
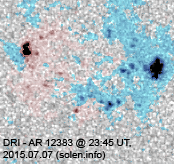 |
 |
|
| S4598 | 2015.07.07 | 1 | 1 | S19E78 | 0270 | HHX |
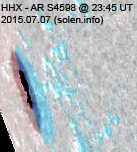 |
||||
| S4599 | 2015.07.07 | 8 | 7 | S11W10 | 0045 | DRI |
 |
||||
| S4600 | 2015.07.07 | 2 | 2 | N09E56 | 0008 | BXO |
 |
||||
| S4601 | 2015.07.07 | 1 | 1 | N17E03 | 0004 | AXX |
 |
||||
| S4602 | 2015.07.07 | 1 | 1 | N09E22 | 0004 | AXX |
 |
||||
| S4603 | 2015.07.07 | 1 | 1 | S16E25 | 0004 | AXX |
 |
||||
| Total spot count: | 48 | 143 | 78 | ||||||||
| Sunspot number: | 118 | 283 | 218 | (total spot count + 10 * number of spotted regions) | |||||||
| Weighted SN: | 79 | 189 | 124 | (Sum of total spot count + classification weighting for each AR. Classification weighting: X=0, R=3, A/S=5, H/K=10) | |||||||
| Relative sunspot number (Wolf number): | 130 | 156 | 185 | k * (sunspot number) As of July 1, 2015: k = 1.1 for SWPC, k = 0.55 for MSN 2K, k = 0.85 for MSN 1K (MSN=Magnetic Sunspot Number) |
|||||||
| Month | Average solar flux | International sunspot number (WDC-SILSO) (4) |
Smoothed sunspot number (4) | Average
ap (3) |
|
|---|---|---|---|---|---|
| Measured | 1 AU | ||||
| 2014.01 | 157.4 | 152.4 | 117.0 | 109.3 (+1.7) | 5.44 |
| 2014.02 | 170.3 (cycle peak) |
166.3 | 146.1 (cycle peak) | 110.5 (+1.2) | 10.70 |
| 2014.03 | 149.9 | 148.5 | 128.7 | 114.3 (+3.8) | 4.88 |
| 2014.04 | 143.9 | 144.8 | 112.5 | 116.4 (+2.1) (solar max) | 7.88 |
| 2014.05 | 129.7 | 132.9 | 112.5 | 115.0 (-1.4) | 5.75 |
| 2014.06 | 122.0 | 125.8 | 102.9 | 114.1 (-0.9) | 6.72 |
| 2014.07 | 137.4 | 141.8 | 100.2 | 112.8 (-1.3) | 4.50 |
| 2014.08 | 124.7 | 127.9 | 106.9 | 108.7 (-4.1) | 7.71 |
| 2014.09 | 146.6 | 148.1 | 130.0 | 102.5 (-6.2) | 9.78 |
| 2014.10 | 153.4 | 152.9 | 90.0 | 98.0 (-4.5) | 8.96 |
| 2014.11 | 154.8 | 151.4 | 103.6 | 95.7 (-2.3) | 9.33 |
| 2014.12 | 158.7 | 153.8 | 112.9 | 93.3 (-2.4) | 11.24 |
| 2015.01 | 141.9 | 137.3 | 97.6 | (91.1 projected, -2.2) | 9.46 |
| 2015.02 | 129.1 | 126.0 | 67.8 | (89.8 projected, -1.3) | 9.92 |
| 2015.03 | 125.9 | 124.6 | 56.8 | (87.3 projected, -2.5) | 16.14 |
| 2015.04 | 128.8 | 129.7 | 78.0 | (83.9 projected, -3.4) | 10.73 |
| 2015.05 | 120.0 | 122.6 | 90.0 | (81.3 projected, -2.6) | 8.29 |
| 2015.06 | 122.3 | 126.1 | 68.3 | (78.0 projected, -3.3) | 12.8 |
| 2015.07 | (120.5) | 22.0 (2A) / 97.4 (2B) / 93.2 (2C) | (74.4 projected, -3.6) | (8.6) | |
1) Running average based on the daily 20:00 UTC observed solar flux value at
2800 MHz.
2A) Current impact on the monthly sunspot number based on the Boulder
(NOAA/SWPC) sunspot number (accumulated daily sunspots / month days).
2B)
Boulder SN current month average to date.
2C) STAR SDO 1K Wolf number 30 day
average.
3) Running average based on the quicklook and definitive Potsdam WDC ap
indices. Values in red are based on the definitive
international
GFZ Potsdam
WDC
ap indices.
4) Updated to new data set from WDC-SILSO on July 1, 2015
This report has been prepared by Jan Alvestad. It is based on the analysis of data from whatever sources are available at the time the report is prepared. All time references are to Universal Time. Comments and suggestions are always welcome.
SDO images are courtesy of NASA/SDO and the AIA, EVE, and HMI science teams.