
The geomagnetic field was quiet on March 3. Solar wind speed at ACE ranged between 393 and 472 km/s, weakly under the influence of effects from CH717.
Solar flux at 20h UTC on 2.8 GHz was 98.7 (decreasing 21.0 over the last solar rotation). The 90 day 10.7 flux at 1 AU was 103.7. The Potsdam WDC planetary A index was 6 (STAR Ap - based on the mean of three hour interval ap indices: 5.8). Three hour interval K indices: 22222101 (planetary), 13232221 (Boulder).
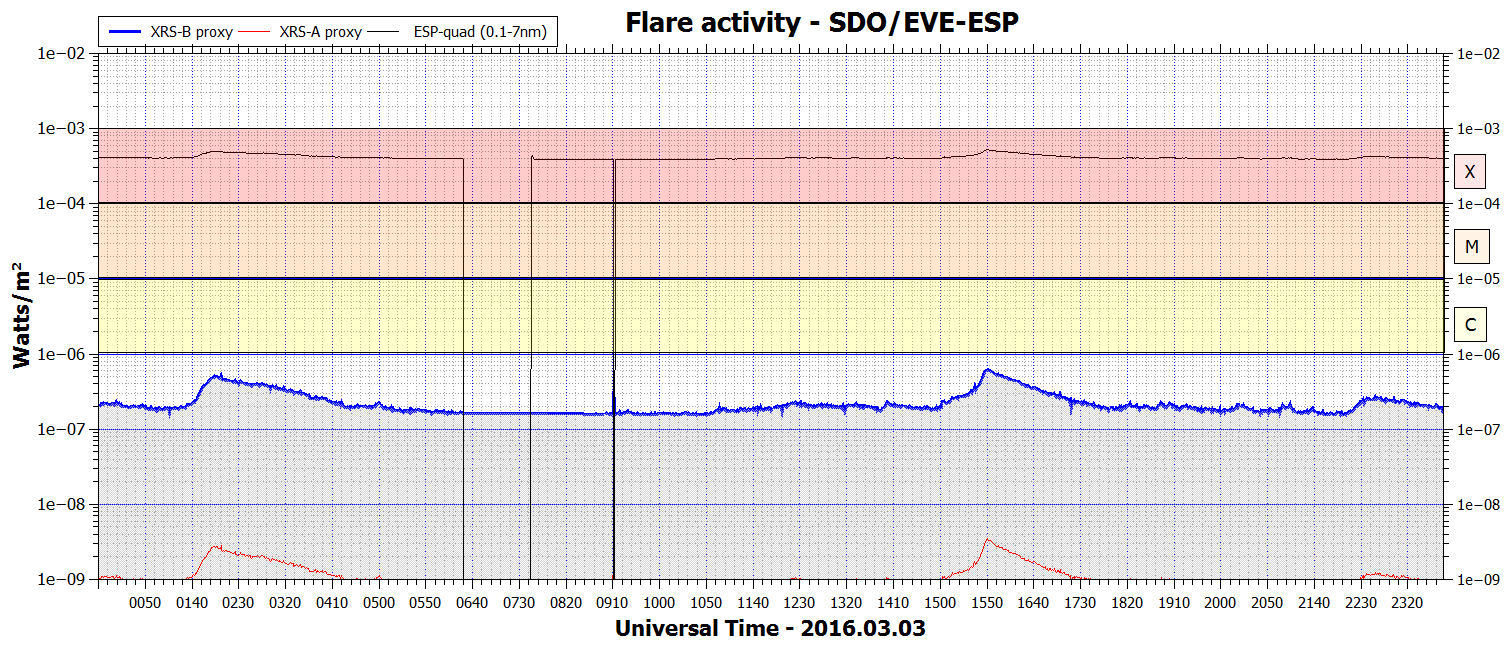
The background x-ray flux is at the class B2 level.
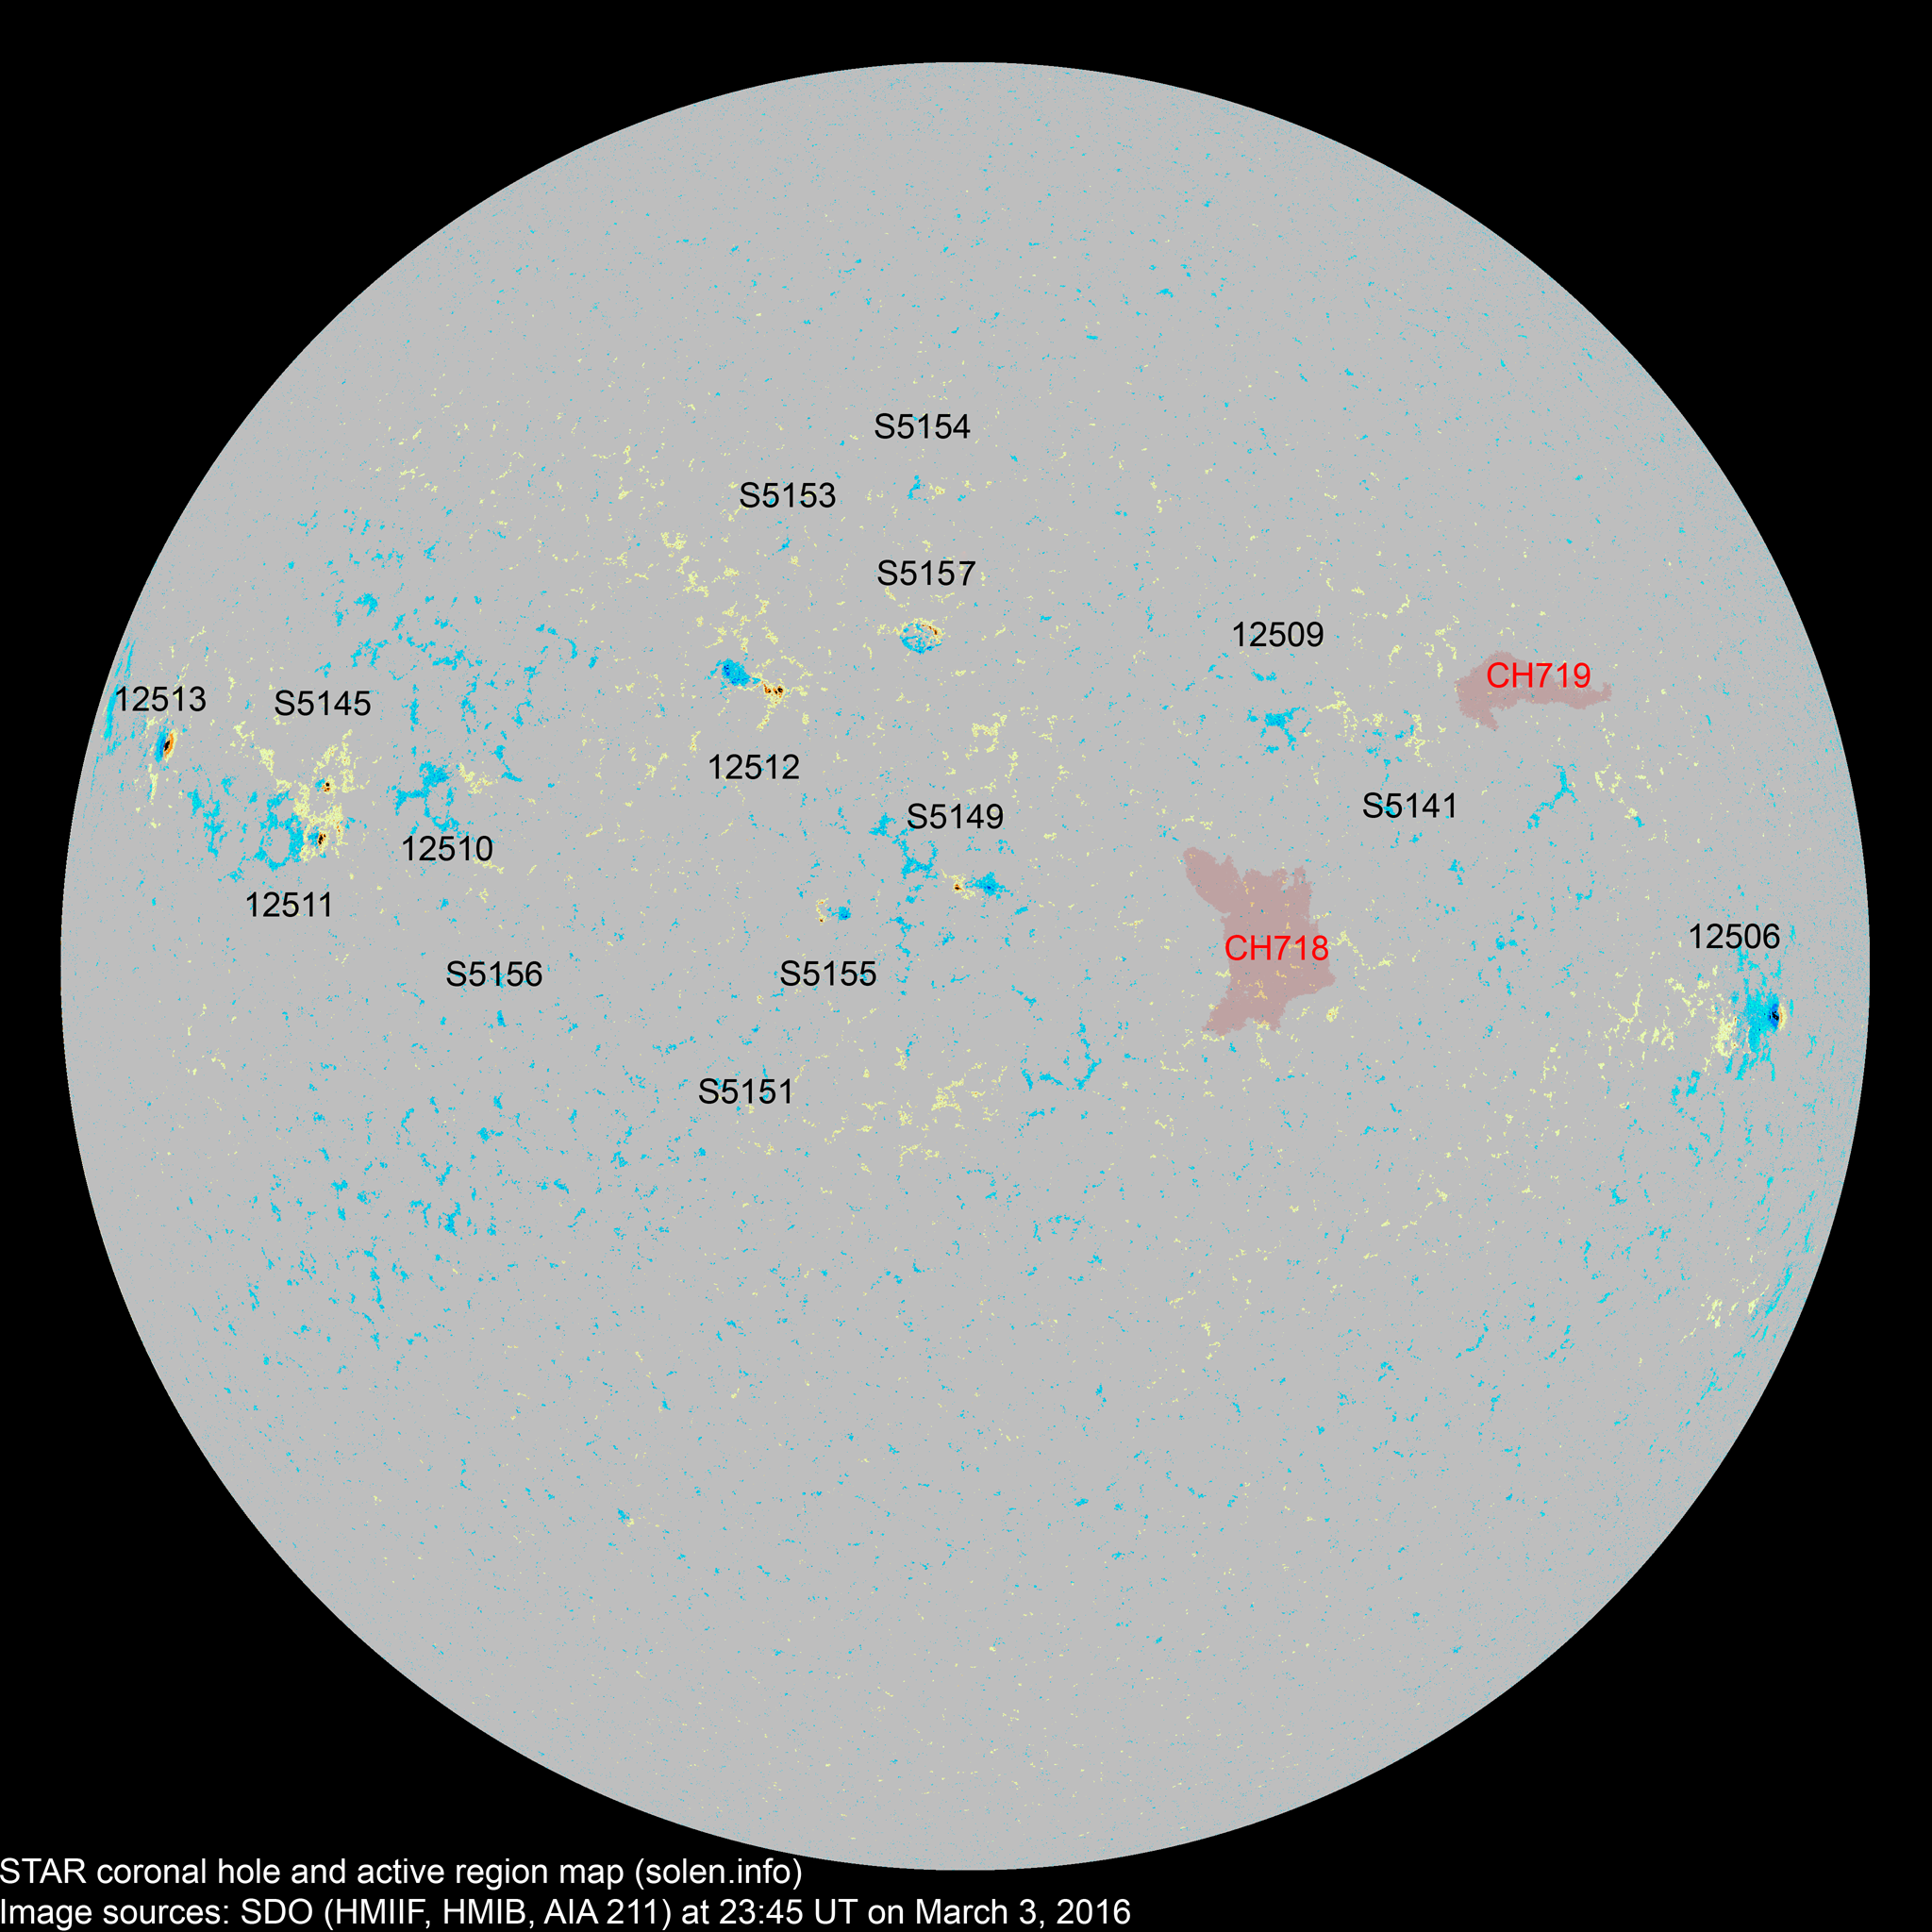
At the time of counting spots (see image time), spots were observed in 15 active regions using 2K resolution (SN: 219) and 9 active regions using 1K resolution (SN: 112) SDO images on the visible solar disk.
Region 12506 [S06W63] decayed slowly and quietly.
Region 12509 [N09W20] reemerged with tiny trailing polarity spots.
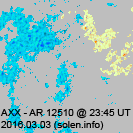
Region 12510 [N06E35] decayed slowly and quietly.
Note that SWPC has switched positions for ARs 12510 and 12511 in their last
region summary, this is highly likely an error. The original numbering will be
kept here to avoid data integrity problems.
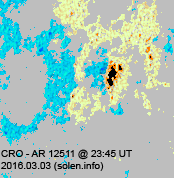
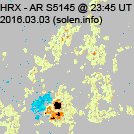
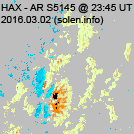
Region 12511 [N03E46] decayed slowly and quietly. SWPC includes AR S5145 in this region.
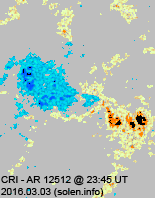
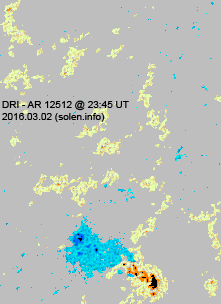
Region 12512 [N11E12] was quiet and stable.
Region 12513 [N11E64] was quiet and stable.
Spotted regions not numbered (or interpreted differently) by SWPC:
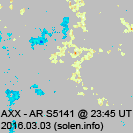
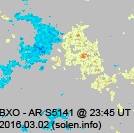
S5141 [N08W29] decayed slowly and quietly.
S5145 [N07E45] decayed slowly and quietly.
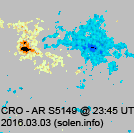
S5149 [S02W00] was quiet and stable.
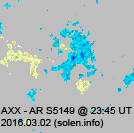
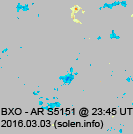
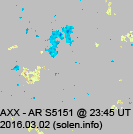
S5151 [S10E13] was quiet and stable.
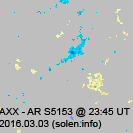
New region S5153 [N20E12] emerged with a tiny spot.
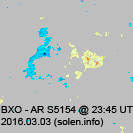
New region S5154 [N25E03] emerged with tiny spots.
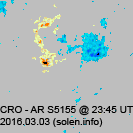
New region S5155 [S04E08] emerged with a few spots.
New region S5156 [S09E31] was observed with a tiny spot.
New region S5157 [N14E03] emerged as a classic bubble of magnetism and
should develop further.
An interesting filament eruption was observed near the center of the visible disk from 14:43 in SDO/AIA imagery. No obvious CME was observed in LASCO imagery.
C2+ flares:
| Magnitude | Peak time (UT) | Location | AR | Recorded by | Comment |
March 1-3: No obviously Earth directed CMEs were observed in available LASCO imagery.
[Coronal hole
history (since October 2002)]
[Compare today's report to the situation one solar rotation ago:
28 days ago
27 days ago
26 days ago]
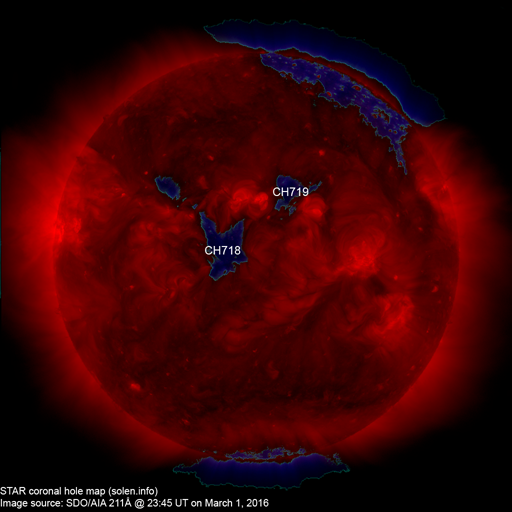
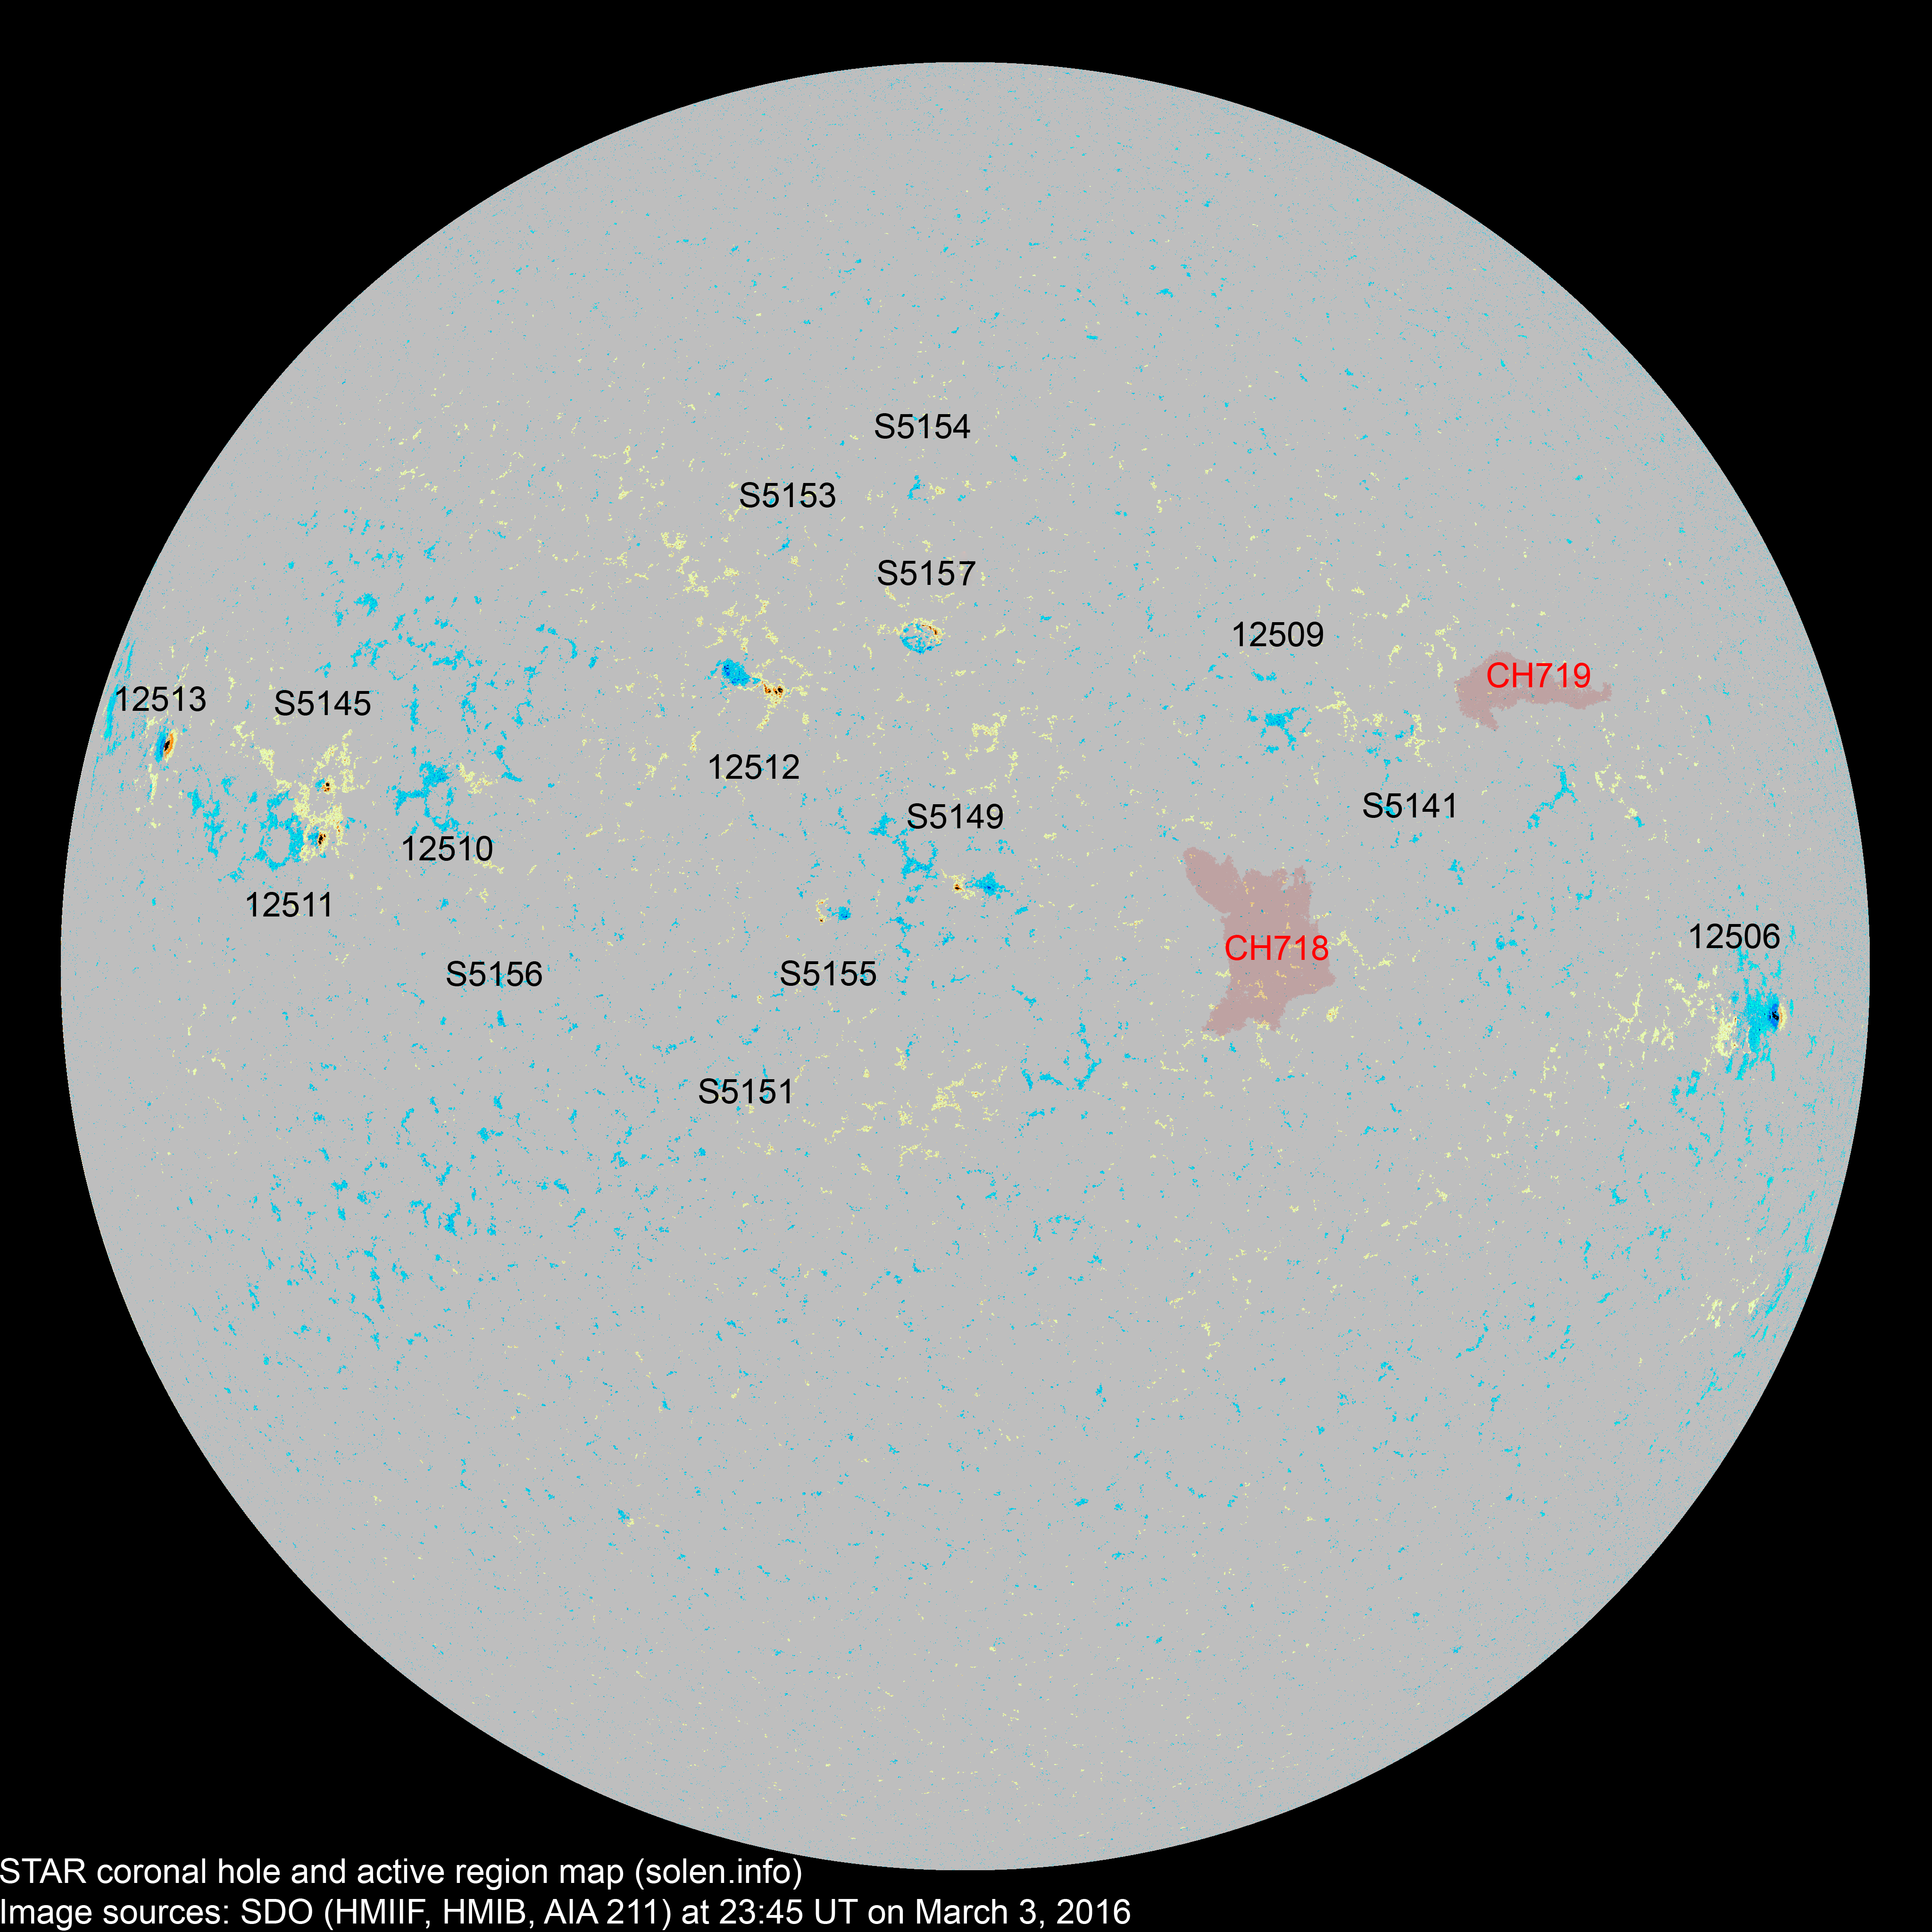
A northern hemisphere coronal hole (CH719) was in an Earth facing position on March 1. A trans equatorial coronal hole (CH718) rotated across the central meridian on March 2.
Long distance low and medium frequency (below 2 MHz) propagation along paths north of due west over upper middle latitudes is fair. Propagation on long distance northeast-southwest paths is poor.
The geomagnetic field is expected to be initially quiet on March 4 becoming unsettled late in the day due to effects from CH719. Effects from CH718 could cause quiet to active conditions on March 5-6.
| Coronal holes (1) | Coronal mass ejection (2) | M and X class flares (3) |
1) Effects from a coronal hole could reach Earth within the
next 5 days. When the high speed stream has arrived the color changes to green.
2) Effects from a CME are likely to be observed at Earth within 96 hours.
3) There is a possibility of either M or X class flares within the next 48
hours.
Green: 0-30% probability, Yellow: 30-70% probability, Red: 70-100% probability.
(Click on image for 2K resolution).
4K resolution.
Compare to the previous day's image.
0.5K image
When available the active region map has a coronal hole polarity overlay where red (pink) is negative and blue is positive.
Data for all numbered solar regions according to the Solar Region Summary provided by NOAA/SWPC. Comments are my own, as is the STAR spot count (spots observed at or inside a few hours before midnight) and data for regions not numbered by SWPC or where SWPC has observed no spots. SWPC active region numbers in the table below and in the active region map above are the historic SWPC/USAF numbers.
| Active region | Date numbered detected |
Spot count | Location at midnight | Area | Classification | SDO / HMI 4K continuum image with magnetic polarity overlays |
Comment | ||||
|---|---|---|---|---|---|---|---|---|---|---|---|
| SWPC | Magnetic (SDO) |
SWPC | STAR | Current | Previous | ||||||
| 2K | 1K | ||||||||||
| 12506 |
2016.02.22 2016.02.24 |
2 | 9 | 1 | S07W60 | 0070 | HSX | CAO |
 |
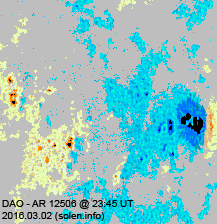 |
area: 0130 location: S06W63 |
| 12509 |
2016.02.25 2016.02.29 |
4 | N09W28 | 0005 | AXX |
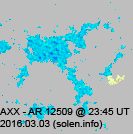 |
location: N09W20 |
||||
| S5131 | 2016.02.25 | N20W59 | |||||||||
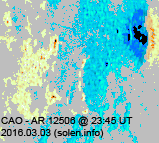
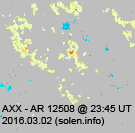
| 12508 |
2016.02.26 2016.02.28 |
N06W49 |
 |
||||||||
| S5134 | 2016.02.26 | S07W20 | |||||||||
| S5136 | 2016.02.27 | S02W57 | |||||||||
| S5137 | 2016.02.27 | S21W49 | |||||||||
| S5138 | 2016.02.28 | N20W35 | |||||||||
| S5140 | 2016.02.28 | S17E04 | |||||||||
| S5141 | 2016.02.29 | 1 | N08W29 | 0001 | AXX |
 |
 |
||||
| 12511 |
2016.02.29 2016.03.02 |
8 | 3 | N06E32 | 0030 | CRO |
 |
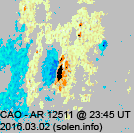 |
SWPC count includes AR S5145 actual location: N03E46 previous SWPC location: N05E57 |
||
| S5143 | 2016.02.29 | N24W45 | |||||||||
| 12512 |
2016.03.01 2016.03.02 |
4 | 16 | 6 | N12E13 | 0020 | BXO | CRI |
 |
 |
area: 0060 |
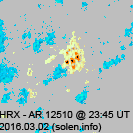
| S5145 | 2016.03.01 | 3 | 2 | N07E45 | 0020 | HRX |
 |
 |
|||
| 12510 |
2016.03.01 2016.03.02 |
3 | 4 | 2 | N05E43 | 0030 | CRO | AXX |
 |
 |
SWPC switched ARs 12510/12511 area: 0015 actual location: N06E35 |
| S5147 | 2016.03.01 | S11W16 |
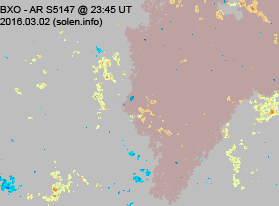 |
||||||||
| 12513 | 2016.03.02 | 1 | 1 | 1 | N11E63 | 0070 | HSX | HSX |
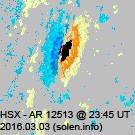 |
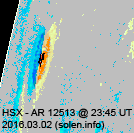 |
location: N11E78 area: 0100 |
| S5149 | 2016.03.02 | 5 | 2 | S02W00 | 0020 | CRO |
 |
 |
|||
| S5151 | 2016.03.02 | 2 | S10E13 | 0003 | BXO |
 |
 |
||||
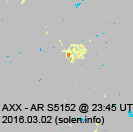
| S5152 | 2016.03.02 | N07E25 |
 |
||||||||
| S5153 | 2016.03.03 | 1 | N20E12 | 0002 | AXX |
 |
|||||
| S5154 | 2016.03.03 | 3 | N25E03 | 0004 | BXO |
 |
|||||
| S5155 | 2016.03.03 | 5 | 2 | S04E08 | 0014 | CRO |
 |
||||
| S5156 | 2016.03.03 | 1 | 1 | S09E31 | 0004 | AXX |
 |
||||
| S5157 | 2016.03.03 | 7 | 4 | N14E03 | 0023 | CRI |
 |
||||
| Total spot count: | 10 | 69 | 22 | ||||||||
| Sunspot number: | 50 | 219 | 112 | (total spot count + 10 * number of spotted regions) | |||||||
| Weighted SN: | 23 | 97 | 50 | (Sum of total spot count + classification weighting for each AR. Classification weighting: X=0, R=3, A/S=5, H/K=10) | |||||||
| Relative sunspot number (Wolf number): | 55 | 99 | 90 | k * (sunspot number) As of February 19, 2015: k = 1.1 for SWPC, k = 0.45 for MSN 2K, k = 0.80 for MSN 1K (MSN=Magnetic Sunspot Number) |
|||||||
| Month | Average solar flux | International sunspot number (WDC-SILSO) (4) |
Smoothed sunspot number (4) | Average
ap (3) |
|
|---|---|---|---|---|---|
| Measured | 1 AU | ||||
| 2014.02 | 170.3 (cycle peak) |
166.3 | 146.1 (cycle peak) | 110.5 (+1.2) | 10.70 |
| 2014.04 | 143.9 | 144.8 | 112.5 | 116.4 (+2.1) (solar max) | 7.88 |
| 2015.01 | 141.9 | 137.3 | 93.0 | 89.3 (-2.9) | 9.46 |
| 2015.02 | 129.1 | 126.0 | 66.7 | 86.1 (-3.2) | 9.92 |
| 2015.03 | 125.9 | 124.6 | 54.5 | 82.2 (-3.9) | 16.14 |
| 2015.04 | 128.8 | 129.7 | 75.3 | 78.8 (-3.4) | 10.73 |
| 2015.05 | 120.0 | 122.6 | 88.8 | 76.0 (-2.8) | 8.29 |
| 2015.06 | 122.3 | 126.1 | 66.5 | 72.0 (-4.0) | 13.15 |
| 2015.07 | 107.0 | 110.8 | 66.4 | 68.2 (-3.8) | 8.83 |
| 2015.08 | 105.4 | 108.0 | 64.6 | 66.3 (-1.9) | 14.58 |
| 2015.09 | 101.7 | 102.7 | 78.1 | (66.0 projected, -0.3) | 15.78 |
| 2015.10 | 104.1 | 103.3 | 61.7 | (65.3 projected, -0.7) | 14.02 |
| 2015.11 | 109.3 | 106.9 | 63.2 | (63.2 projected, -2.1) | 12.09 |
| 2015.12 | 113.1 | 109.5 | 57.7 | (61.5 projected, -1.7) | 14.29 |
| 2016.01 | 103.4 | 100.1 | 56.6 | (59.8 projected, -1.7) | 9.4 |
| 2016.02 | 103.6 | 101.0 | 57.2 | (57.4 projected, -2.4) | 9.9 |
| 2016.03 | (97.9) | 5.0 (2A) / 51.3 (2B) / 79.7 (2C) | (54.5 projected, -3.1) | (6.0) | |
1) Running average based on the daily 20:00 UTC observed solar flux value at
2800 MHz.
2A) Current impact on the monthly sunspot number based on the Boulder
(NOAA/SWPC) sunspot number (accumulated daily sunspots / month days).
2B)
Boulder SN current month average to date.
2C) STAR SDO 1K Wolf number 30 day
average.
3) Running average based on the quicklook and definitive Potsdam WDC ap
indices. Values in red are based on the definitive
international
GFZ Potsdam
WDC
ap indices.
4) Updated to new data set from WDC-SILSO on July 1, 2015
This report has been prepared by Jan Alvestad. It is based on the analysis of data from whatever sources are available at the time the report is prepared. All time references are to Universal Time. Comments and suggestions are always welcome.
SDO images are courtesy of NASA/SDO and the AIA, EVE, and HMI science teams.